Expert Training
We have the right data analytics training for you. All the latest data analytics techniques and software training. Tap into our experience and master invaluable tricks and shortcuts.
Premium Services
We are simply the best. With us you are guaranteed of the most efficient path to acquiring data analytics skills.
Well Experienced
Highly experienced team and a record of delivering quality data analytics training and advisory services. We present tools like Microosft Excel, Power BI etc in a language you understand.

Our Services

We provide the worlds best data analytics training services, allowing you you to produce better quality reports and save time by automating repetitive tasks. Our training services are geared towards creating time through the use of data analytics tools and techniques to generate and present actionable business insights. With our Microsoft Excel Training Courses you can unleash the power of the software you already have!

Value for Money

We provide the highest quality of detailed data analytics training to add value to your employees and your business. With us, your data analytics training generates the ability to produce insights which put more money in your pocket.

Microsoft Excel Data Analytics Training Courses

Learn the skills that will help you analyse data and present top quality reports using Microsoft Excel Analytics. Unleash the power of the world’s leading spreadsheet and acquire top class data analytics skills which improves your value to your organisation.

SPSS Data Analysis Training Courses

Within a very short time you will master all the essential skills of an SPSS data analyst, from the simplest operations with data to the advanced multivariate techniques like logistic regression, multidimensional scaling or principal component analysis.

You can increase productivity and create time with data analytics!

Need your team trained up in data analytics without breaking your budget? Contact us for a quote

Blog

Stay updated with the latest trends by reading our articles written by content writers in the industry.

Connecting Excel to the Cloud

Connecting Excel to the Cloud: Unleash the Power of Your Data

Microsoft Excel remains a cornerstone for data analysis and manipulation. But in today’s world, keeping your spreadsheets isolated on a local machine can limit your potential. Connecting Excel to the cloud opens a world of possibilities, allowing you to collaborate, access data from anywhere, and leverage powerful cloud-based tools.

Why Connect Excel to the Cloud?

Here are some compelling reasons to take your spreadsheets to the cloud:

  • Enhanced Collaboration: Cloud storage platforms, like OneDrive or Google Drive, enable real-time collaboration. Team members can access and edit the same spreadsheet simultaneously, eliminating version control issues and streamlining teamwork.
  • Accessibility Anywhere, Anytime: Access your spreadsheets from any device with an internet connection. No more scrambling to find the latest version on your local machine – your data is always available on the cloud.
  • Integration with Cloud Services: Unlock the potential of powerful cloud-based tools like Power BI (Microsoft) or Google Data Studio. These platforms seamlessly integrate with Excel, allowing you to analyze large datasets, create interactive visualizations, and generate insightful reports.
  • Improved Version Control and Backup: Cloud storage automatically saves changes, providing a secure backup solution and eliminating the risk of data loss from local hardware failures.
  • Scalability and Flexibility: Cloud platforms offer the ability to scale your storage capacity as your data needs grow. No need to worry about exceeding local storage limitations.

How to Connect Excel to the Cloud:

There are two main approaches to connecting Excel to the cloud:

  • Cloud Storage: Save your Excel files on a cloud storage platform like OneDrive, Google Drive, or Dropbox. This allows you and your team to access the files from anywhere with an internet connection.
  • Cloud Data Services: Connect Excel to cloud data services like Power BI or Google Data Studio. This enables you to import data directly from the cloud, analyze it within Excel, and build interactive dashboards and reports.

Connecting to cloud storage platforms is a straightforward process. Simply save your Excel files within the chosen cloud folder on your device. The platform automatically synchronizes the files, making them accessible from any device connected to the internet.

Connecting to cloud data services involves a few additional steps. These services typically provide specific instructions and add-ins for Excel that facilitate the connection and data import process.

Embrace the Advantages of a Cloud-Connected Excel

By embracing cloud connectivity, you can unlock new levels of efficiency and collaboration within Excel. Work seamlessly with your team, access your data anywhere, and leverage powerful cloud tools to take your data analysis to the next level. So, ditch the limitations of local storage and connect your Excel to the cloud – the future of data analysis awaits!

Have you explored connecting Excel to the cloud? Share your experiences and tips in the comments below!

8th Floor ZB Chambers
15 George Silundika Avenue,
Harare, Harare 263
Zimbabwe
Phone: 0719397464

Unlocking the power of checkboxes in Excel

Uncovering Patterns: Exploratory Data Analysis in Action

10 Excel Functions you must know

Microsoft Power BI Training Course

slot88

monperatoto

situs slot terbaik

toto slot

slot gacor

pengeluaran hk

situs toto

situs togel

situs toto

kampungbet

situs togel

toto slot

toto slot

toto slot

slot gacor

kampungbet

situs toto

slot gacor hari ini

toto slot

https://ijins.umsida.ac.id/data/

situs toto

toto slot

toto togel

toto slot

kampungbet

toto slot

slot gacor

slot gacor

https://polreskedirikota.id/

slot gacor

Unlocking the power of checkboxes in Excel
checkboxes

Unlocking the Power of Checkboxes in MS Excel: A Game-Changer for Data Entry and Interactivity

For years, Excel users have relied on cumbersome methods for data selection and interaction. But with the introduction of checkboxes, a new era of user-friendly data management has arrived. Whether you’re a seasoned Excel pro or just starting your spreadsheet journey, understanding the power of checkboxes can transform your workflow.

What are Checkboxes in Excel?

Checkboxes are interactive elements that can be inserted into your spreadsheet cells. Clicking a checkbox allows you to select or deselect an option, visually representing the underlying data (TRUE or FALSE). This makes data entry and manipulation much easier and more intuitive for users.

Benefits of Using Checkboxes:

  • Simplified Data Entry: Gone are the days of manually entering “Yes” or “No” or using cumbersome drop-down menus. Checkboxes offer a quick and clear way to select options, reducing errors and speeding up data input.
  • Enhanced User Experience: Checkboxes add a visual element to your spreadsheet, making it interactive and user-friendly. Users can easily identify and select options, improving the overall experience.
  • Improved Data Filtering and Sorting: Leveraging checkboxes, you can filter and sort your data based on selected options. This enables you to quickly focus on specific subsets of data, enhancing analysis and reporting capabilities.
  • Dynamic Dashboards: Integrating checkboxes into your dashboards allows users to interact with the data visually. By checking or unchecking boxes, users can filter the displayed information in real-time, fostering self-service data exploration.

How to Use Checkboxes in Excel:

Adding checkboxes in Excel is a simple process:

  1. Select the cells where you want to insert the checkboxes.
  2. Go to the Developer tab (if it’s not visible, you can enable it by going to File > Options > Customize Ribbon and checking the box next to Developer).
  3. Click the Insert button in the Controls section of the Developer tab.
  4. Choose Checkbox from the list of options.
  5. Once inserted, customize the checkbox properties by right-clicking it and selecting Format Control. Here you can adjust the appearance and link the checkbox to a specific cell containing the TRUE/FALSE value.

Creative Applications of Checkboxes:

Beyond basic data entry, checkboxes can be used for various creative applications:

  • Create To-Do Lists: Use checkboxes to mark completed tasks, providing a visual progress tracker.
  • Track Inventory Status: Implement checkboxes to indicate available or unavailable items.
  • Build Interactive Surveys: Design surveys with checkbox options for user selection.
  • Filter Data Based on Multiple Criteria: Combine checkboxes with other filtering methods to create dynamic and complex data exploration options.

Unlocking the potential of checkboxes in MS Excel offers significant benefits for both data entry and data interaction. By incorporating these interactive elements into your spreadsheets, you can improve efficiency, enhance user experience, and build more dynamic and informative reports.

Do you have any creative ways you’ve used checkboxes in Excel? Share your tips and experiences in the comments below!

8th Floor ZB Chambers
15 George Silundika Avenue,
Harare, Harare 263
Zimbabwe
Phone: 0719397464

Marketing Analytics: From Buzzword to Business Booster

Why learn Excel?

10 Excel Functions you must know

7 tools every Excel user must know

If you have any quesries you are free to contact us.

Please enable JavaScript in your browser to complete this form.
Name

slot88

monperatoto

situs slot terbaik

toto slot

slot gacor

pengeluaran hk

situs toto

situs togel

situs toto

kampungbet

situs togel

toto slot

toto slot

toto slot

slot gacor

kampungbet

situs toto

slot gacor hari ini

toto slot

https://ijins.umsida.ac.id/data/

situs toto

toto slot

toto togel

toto slot

kampungbet

toto slot

slot gacor

slot gacor

https://polreskedirikota.id/

slot gacor

THE COUNT FUNCTION IN EXCEL
The COUNT function in Excel

The COUNT Function in Excel

The COUNT function is a powerful tool in Microsoft Excel that enables users to count the number of cells within a range that contains numerical values. It is particularly useful when dealing with large datasets or when you want to quickly determine the number of entries that meet specific criteria. In this lecture, we will explore the syntax of the COUNT function and provide examples using demo data.

Syntax:
The syntax for the COUNT function is as follows:

=COUNT(value1, [value2], …)

The COUNT function can accept one or more arguments, separated by commas. Each argument represents a range or value that you want to count.

Examples:

Example 1:
Let’s consider a simple example where we have a list of students and their respective test scores. We want to count the number of students who scored above 80.

| A | B |
|——–|———|
| Name | Score |
| John | 75 |
| Sara | 92 |
| Mark | 81 |
| Emma | 78 |
| David | 86 |

COUNT

COUNT(value1, value2, …)

  • value1, value2, …: These are the values or ranges that you want to count. You can include up to 255 arguments, which can be individual cells, cell references, or ranges separated by commas.

Note: The COUNT function ignores any text or empty cells within the specified range. It only considers cells that contain numbers or dates.

COUNT(A2:B6)

This formula counts the number of cells within the range A2:B6 that contain numeric values.

It returns the value 5 which is the number of numerical values in the range.

COUNTIF

To count the number of students who scored above 80, we can use the COUNT function as follows:

=COUNTIF(B2:B6, “>80”)

Explanation:
– B2:B6: This represents the range of cells containing the scores.
– “>80”: This is the criteria we want to apply, i.e., scores greater than 80.

The COUNTIF function counts the number of cells within the specified range (B2:B6) that meet the given criteria (>80).

Result: The COUNTIF function will return the value 3 since there are three students who scored above 80.

Example 2:

COUNTA

Now, let’s consider a scenario where we have a dataset with missing values represented by blank cells. We want to count the number of non-blank cells in a given range.

| A | B |
|——–|———|
| Name | Score |
| John | 75 |
| Sara | |
| Mark | 81 |
| Emma | |
| David | 86 |

To count the number of non-blank cells in the range B2:B6, we can use the COUNTA function as follows:

=COUNTA(B2:B6)

Explanation:
– B2:B6: This represents the range of cells for which we want to count the non-blank cells.

The COUNTA function counts the number of non-blank cells within the specified range (B2:B6).

Result: The COUNT function will return the value 3since there are three non-blank cells in the range.

Microsoft Excel Certification Traininig

Why learn Excel?

7 tools every Excel user must know

10 Excel Functions you must know

8th Floor ZB Chambers
15 George Silundika Avenue,
Harare, Harare 263
Zimbabwe
Phone: 0719397464

slot88

toto slot

toto togel

toto slot

https://polreskedirikota.id/

slot gacor

Microsoft Excel certification exam MO-210
Microsoft logo

Microsoft Excel certification exam MO-210

Microsoft Excel certification exam MO-210 is a Microsoft Office Specialist (MOS) exam that measures a candidate’s ability to use Microsoft Excel 2022 and later to create and manage worksheets and workbooks, create cells and ranges, create tables, apply formulas and functions, and create charts and objects.

The exam is 120 minutes long and consists of 75 multiple-choice questions. The passing score is 700.

Exam requirements

To be successful on the exam, candidates should have the following skills:

  • Create and manage worksheets and workbooks
  • Create cells and ranges
  • Create tables
  • Apply formulas and functions
  • Create charts and objects

Candidates can prepare for the exam by taking a Microsoft-approved training course or by using self-study resources such as books, online tutorials, and practice exams.

The exam fee is $100.

The Microsoft Excel certification exam MO-210 is a valuable credential for anyone who wants to demonstrate their skills in using Microsoft Excel. The certification can help candidates improve their job prospects and earn higher salaries.

Benefits of taking the exam

Here are some of the benefits of getting certified in Microsoft Excel:

  • Increased job opportunities: Employers are increasingly looking for employees with Microsoft Excel skills. Certification can help you stand out from the competition and increase your chances of getting hired.
  • Higher salaries: Certified Microsoft Excel professionals earn higher salaries than non-certified professionals. According to a study by PayScale, the average salary for a certified Microsoft Excel professional is $80,000 per year.
  • Improved career prospects: Certification can help you advance your career and take on more challenging and rewarding roles.
  • Increased confidence: Certification can give you the confidence you need to use Microsoft Excel effectively in your work.

If you are interested in getting certified in Microsoft Excel, I encourage you to check out the Microsoft Excel certification exam MO-210. It is a valuable credential that can help you improve your job prospects, earn higher salaries, and advance your career.

At Data Analytics Training and Advisory Services we offer training to prepare you for the MO 210 Examinantion. Our training is designed to help you pass without much fuss.

Contact us to enrol for training

    8th Floor ZB Chambers
    15 George Silundika Avenue,
    Harare, Harare 263
    Zimbabwe
    Phone: 0719397464

    Microsoft Excel Certification Training

    Why learn Excel?

    10 Excel Functions you must know

    7 tools every Excel user must know

    Why learn Excel?
    Why learn Excel?

    Why learn Excel?

    Why learn Excel in the first place? Microsoft Excel training courses have become increasingly popular in recent years due to the growing need for users to be able to understand and use the software proficiently. Enrolling in formal training helps you learn the different elements faster than if you discover them as you go. Learning how to use Microsoft Excel not only allows you to carry out complex data analysis more quickly and accurately, but also saves you time on other tasks such as creating spreadsheets or graphs.

    Boosting your resume

    Furthermore, the knowledge you gain from formal training courses can also help boost your resume, showing potential employers that you have a strong understanding of computer software. With the range of benefits that come with taking a Microsoft Excel training course, it is easy to see why such courses are becoming increasingly popular. This is particularly true in the current technological climate, where most employers prefer applicants to have at least a basic understanding of computer software.

    Practical skills

    Taking a Microsoft Excel course not only allows you to create complex data analysis faster and more accurately, but also gives you the ability to quickly and efficiently create spreadsheets or graphs. Having a comprehensive knowledge of the Microsoft Excel software can thus prove to be very beneficial for potential employees, since it allows them to demonstrate their skills and competence in data management.

    Productivity

    Additionally, mastering the use of Microsoft Excel is not just advantageous for prospective employees; it is also beneficial for those who are already employed. Being able to effectively utilize the Microsoft Excel software can help employees better manage their data, improve their workflow and productivity, and stay ahead of the curve. It can also give employers confidence in their employee’s ability to successfully handle large data sets and keep up with the latest technology. Therefore, having a deep understanding of the Microsoft Excel software is an invaluable asset in today’s professional environment.


    10 Excel Functions you must know

    10 Excel shortcuts you must know

    10 principles of data-driven companies

    10 Excel Functions you must know
    10 Excel functions you must know

    10 Excel Functions You Must Know

    10 Microsoft Excel functions you must know:

    (1) XLOOKUP

    (2) Wildcards

    (3) Sparklines

    (4) Filter

    (5) Pivot Tables

    (6) IF

    (7) SUMIFS

    (8) COUNTIFS

    (9) Transpose

    (10) TRIM

    (1) XLOOKUP:

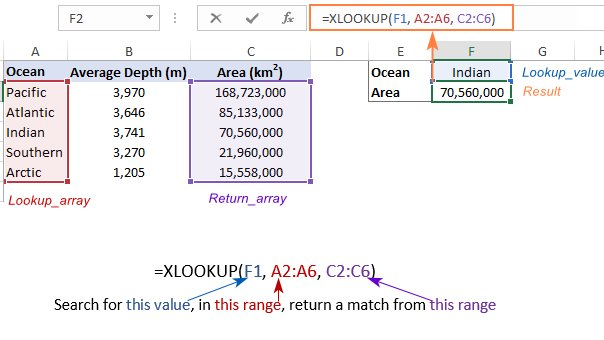
    XLookup is an upgrade compared to VLOOKUP or Index & Match.

    Use the XLOOKUP function to find things in a table or range by row.

    Formula: =XLOOKUP (lookup value, lookup array, return array)

    XLOOKUP

    (2) Wildcards:

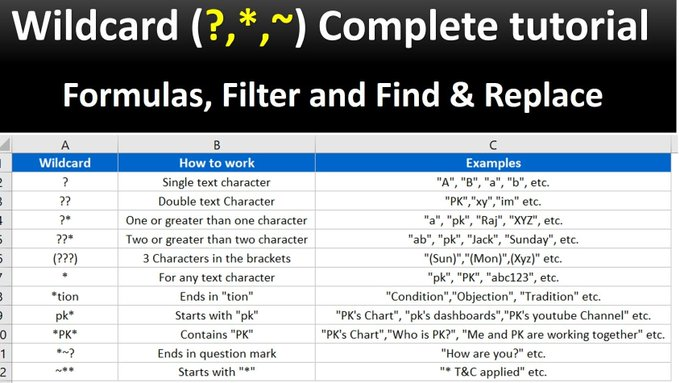
    A wildcard is a special character that allows you to perform partial matches in your Excel formulas. Excel has three wildcards: • asterisk “*” • question mark “?” • tilde “~”


    WILDCARD

    (3) Sparklines:

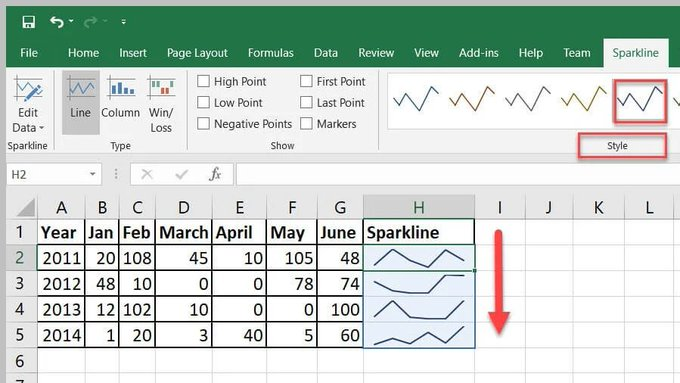
    Sparklines allow you to insert mini graphs inside a cell to provide a visual representation of data. Use sparklines to show trends or patterns in data. On the ‘Insert tab’, click ‘Sparklines’

    SPARKLINES

    (4) Filter:

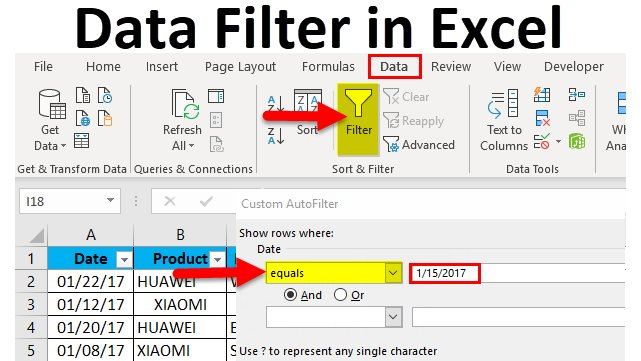
    The FILTER function allows you to filter data based on a query. For example, you can filter a column to show a specific product or date.

    You can also sort in ascending or descending order.

    The shortcut for this function is CTRL + SHFT + L


    FILTER

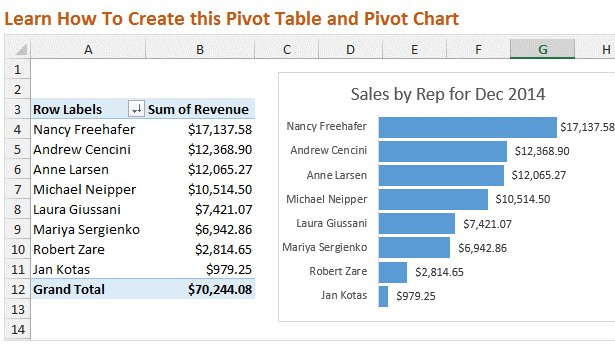
    5) Pivot Tables:

    A powerful tool to calculate, summarize & analyze data, which allows you to compare or find patterns & trends in data. To access this function, go to “Insert” in the Menu bar, and then select “Pivot Table”

    PIVOT TABLES

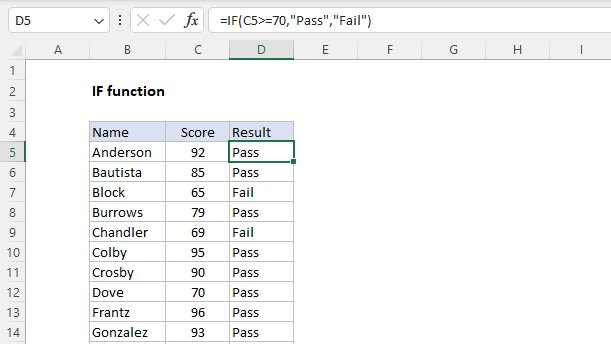
    (6) IF:

    The IF function makes logical comparisons & tells you when certain conditions are met.

    For example, a logical comparison would be to return the word “Pass” if a score is >70, and if not, it will say “Fail” An example of this formula would be =IF(C5>70,”Pass”,”Fail”)

    IF FUNCTION

    (7) SUMIFS:

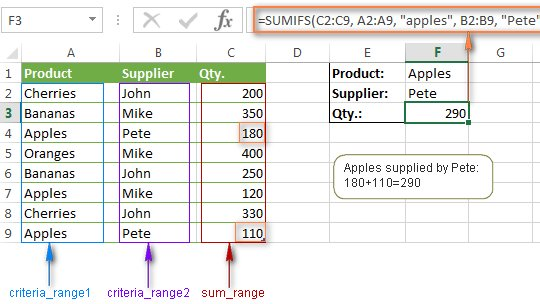
    SUMIFS sum the values in a range that meet multiple criteria.

    For example, use it if you want the sum of two criteria, for example, Apples from Pete. The formula is SUMIFS (sum_range, criteria_range1, criteria1, [criteria_range2, criteria2], …)

    SUMIFS

    (8) COUNTIFS:

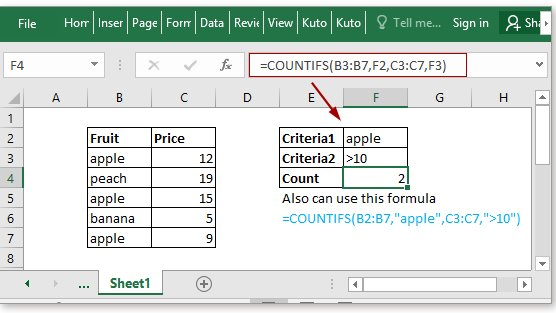
    CountIf counts the number of times a criteria is met. For example, it counts the number of times that both (1) apples and (2) price > $10, are mentioned.
    COUNTIFS

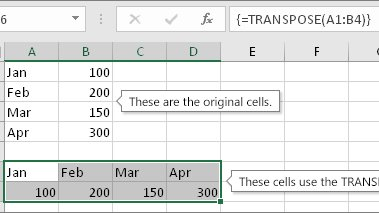
    (9) Transpose:

    This will transform items in rows, to instead be shown in columns or vice versa.
    To transpose a column to a row: • Select the data in the column • Select the cell you want the row to start • Right click, choose to paste special, select transpose
    TRANSPOSE

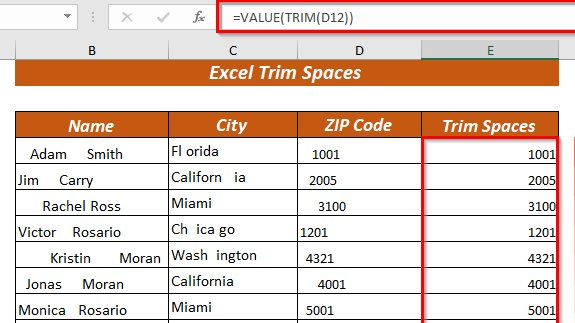
    (10) TRIM:

    TRIM removes the extra spaces in data.
    TRIM can be useful in removing irregular spacing from imported data =TRIM()
    TRIM

    7 tools every Excel user must know

    10 Excel shortcuts you must know

    Jobs where Excel skills will pay you handsomely

    7 tools every Excel user must know
    business analytics using Excel

    7 tools every Excel user must know

    7 tools every Excel user must know were selected and presented by experts to help you get more out of excel.  7 tools which are set to improve your productivity and make you love excel more and more.

    1. Slicers

    Being able to quickly drill down into data is critical when analyzing. Instead of applying filters manually, add slicers to the data by navigating to the Insert tab > Slicers > select what you want to filter the data by and hit OK. Now just click any button to filter!

    2. Power Query

    Importing data into Excel never is as easy as it seems. Luckily, Power Query is here to fix that. Power Query imports data from various sources into Excel. So instead of copying data from the web, go to Data > From Web > enter URL > select the table and hit load.

    3. Data types

    Say goodbye to google searching and hello to data types. Data types pull in real-time data directly into your workbook. To create data types, select the data > Data tab > Select the data category. Now, you can select the data attributes you want to pull into Excel.

    4. Named Ranges

    Naming data will not only make your life easier when writing formulas but also make your formulas easier to understand. To name data, select the data > press CTRL SHIFT F3 > check where the headers are and press OK. Now you can reference the data by its name!

    5. Custom Lists

    If you enter recurring lists repeatedly, this one’s for you. You can create a custom list that Excel will recognize and autofill for you. Go to File > Options > Advanced > Edit Custom Lists > Import List > OK. Now, enter any value and fill with the fill handle.

    7. Sparklines

    Stay on top of (Excel) trends with sparklines. A sparkline is a mini line chart that visually represents data trends. To insert them, press ALT N SL > select the data range you want to visualize and hit okay. Lastly, fill the sparklines down using the fill handle.

    10 must know Excel shortcuts

    Why you should use data analysis in business

    Data Analytics Training Courses

    Jobs where Excel skills will pay you handsomely
    business analytics using Excel

    Jobs where Excel skills will pay you handsomely

    Jobs where Excel skills will pay you handsomely are probably the main reason why you should master Excel. The basic spreadsheet may hold the secret to the profession you want, whether you are currently an Excel pro or still have a ways to go. The demand for basic computer abilities in middle-skill professions has significantly increased over the past two years, according to 27 million job advertisements on various recruitment portals. This includes desirable skills for employers like word processing and of course, mastery of spreadsheets.

    According to a survey by Capital One and Burning Glass Technologies, having these abilities is not only necessary for the vast majority (82%) of middle-skill professions, but it also opens the door for people without university degrees to high-paying careers.

    Excel’s interface may appear straightforward and familiar to everyone, but behind are strength and sophistication that, 30 years after its introduction, are still unsurpassed. Because of this, anyone who wishes to advance in their career should have solid Excel skills. In fact, a sizable percentage of occupations require Excel, according to thousands of job advertisements. This extensive selection may contain the ideal option for you:

    Accountants and auditors

    These people may have been in mind when Excel was created, with the traditional accounting ledger serving as the basis for spreadsheets. To keep businesses profitable, these experts produce and carefully examine cash flows, income statements, balance sheets, and tax reports. Without a college degree, getting this job would be next to impossible, but having solid Excel accounting abilities and certifications can put you in a better position for leadership positions and promotions.

    Administrative assistants, office clerks, information staff

    Business operations are facilitated by administrative assistants, who include secretaries and other general office clerks. They set up appointments, handle records, arrange paperwork, create reports, and assist workers, clients, and guests. They frequently use spreadsheet programs like Excel and word processing applications.

    Business, management, and market analysts

    Business analysts can use a potent Excel function called PowerPivot to extract more insightful information from vast amounts of data and this tool was made specifically for them. These experts support their firms’ strategic business decisions, particularly when it comes to market trends, competitive environments, and long-term profitability. To develop projections, identify strengths, weaknesses, and other patterns, they examine both historical and current data.

    Cost estimators

    Cost estimators are the best resource for getting the most value for your money. To provide precise estimates of the sum of money, time, and labor needed for a particular project, cost estimators frequently collaborate with project managers and engineers. Excel is used to input all necessary information and perform automatic computations for benchmark amounts.

    Educators, teaching assistants, and teachers

    In addition to their subject-specific expertise, educators must be adept in planning their classes, monitoring student attendance, and creating lesson plans. The majority of teachers can complete these activities using Excel’s features and support system, making them proficient users of general spreadsheets. Excel is a very important tool for many teachers in their assignments as well as graduate and postgraduate research, in addition to helping them keep track of their students’ contact information.

    Financial analysts, investment bankers, and loan officers

    Excel is a favored app among financial analysts, bankers, and other money-focused professionals because of its grasp of money.

    Financial analysts assist people and businesses in making wise loan or investment decisions. Although they employ a plethora of financial software, spreadsheets are among the most effective tools for analyzing various financial data sets. Excel has therefore become a requirement for this position.

    Market research analysts and digital marketers

    Data science is at the centre of hard core marketing. Professional market researchers rely on their abilities at acquiring, processing, and analyzing field data, drawing on both creative and analytical thinking. These employees rely on Excel spreadsheets to compile and analyze their research. To reach and convert audiences, marketers look for new market opportunities and employ a variety of tactics, including search engine optimization (SEO). To persuade executives of the effectiveness and return on investment of suggested initiatives, they also employ charts, graphs, and other data visualizations.

    Project managers, project coordinators, and construction managers

    Project managers can be found in a variety of industries, with the construction and IT sectors dominating. They organize, coordinate, and oversee the creation of software or the construction of various structures. They establish standards, allocate responsibilities to workers, control expenses, and zealously maintain timeliness and budget compliance. Microsoft Excel is one of the main tools they regularly utilize, even if they frequently employ specialist software, to handle a variety of jobs quickly.

    Sales, marketing, training and administrative managers

    Given that both sales and marketing are referred to as “numbers games,” it is evident that they incorporate numbers. Spreadsheet software follows numbers wherever they go. While planning, scheduling, and organizing various tasks and resources, frequently with associated budgets and timestamps, are necessary for administration and training. Excel naturally helps make sense of everything when time and money are important. Managers rely on Excel to carry out their primary duties, which range from market research and inventory management to financial modeling and data analysis.

    The list is not exhaustive but a good illustration of why everyone needs to learn Excel.

    10 must know Excel shortcuts

    Microsoft Excel Training Course for beginners

    Microsoft Excel Training Course for Intermediate level

    Advanced Microsoft Excel Training Course

    Microsoft Excel Data Analysis Training Course

    8th Floor ZB Chambers
    15 George Silundika Avenue,
    Harare, Harare 263
    Zimbabwe
    Phone: 0719397464


    10 Excel shortcuts you must know
    Microsoft Excel Training Courses

    10 Excel shortcuts you must know

    1. CTRL E

    CTRL E makes complicated tasks easier than ever, thanks to Flash Fill. Flash Fill automatically fills data down a column based on detected patterns. Just enter how you want the data to appear, hit CTRL E, and Excel will fill the pattern down the column in a flash.

    2. ALT =

    Let Excel do the math for you with this shortcut! ALT = detects data in adjacent cells and automatically sums it using the SUM function. Just select an empty cell adjacent to the data that needs to be added and press ALT =.

    3. ALT H O I

    If you are unable to see your data, ALT H O I is here to help! Press ALT H O I to automatically adjust the column widths to fit the size of your data.

    4. ALT ↓

    If you are entering repetitive data in Excel, ALT ↓ is a must-know shortcut. The Alt ↓ shortcut displays a dropdown list of all values previously entered in the column. Now, you can simply select any value, which will automatically be entered into the active cell!

    5. CTRL `

    When cranking out formulas in Excel, checking each one individually in the formula bar can be tedious. Instead, try the CTRL ` shortcut! CTRL ` toggles between displaying the cells’ formulas and values in the active worksheet.

    6. CTRL ENTER

    Dragging formulas down columns and then again across rows can be a drag. Say goodbye to the fill handle and hello to CTRL ENTER! CTRL ENTER fills the active cell’s contents into selected cells. Note: The active cell has to be in editing mode for this to work.

    7. CTRL T

    Start getting into the routine of using Tables with CTRL T. CTRL T converts data to an Excel Table. Tables are a powerful tool that clean up formatting, auto-fill formulas down columns, automatically expand and update linked charts when new rows are added, and more!

    8. ALT F1

    If you are spending too much time creating charts to visualize data, meet ALT F1. These two magical keys automatically create a bar chart using the selected data and insert it right into the active worksheet!

    9. ALT W VG

    Are you team gridlines or no gridlines? If you’re team no gridlines, this ones for you. The ALT W VG shortcut removes all gridlines from the active worksheet.

    10. CTRL SHIFT L

    Last but not least, CTRL SHIFT L. CTRL SHIFT L makes analyzing large data sets a little easier by adding the Sort & Filter toggles to the top row of the data set, so you can quickly sort and filter data.

    Like these shortcuts and want more? You can learn much more about Excel shortcuts and tricks by attending our training courses.

    Microsoft Excel Data Analysis Training Course

    Advanced Microsoft Excel Training Course

    Business Analytics with Excel Training Course

    Financial Modelling Using Excel Training Course

    Advanced Statistical Analysis Using SPSS Training Course

    8th Floor ZB Chambers
    15 George Silundika Avenue,
    Harare, Harare 263
    Zimbabwe
    Phone: 0719397464