Archives 2023

THE COUNT FUNCTION IN EXCEL

The COUNT function in Excel

The COUNT Function in Excel

The COUNT function is a powerful tool in Microsoft Excel that enables users to count the number of cells within a range that contains numerical values. It is particularly useful when dealing with large datasets or when you want to quickly determine the number of entries that meet specific criteria. In this lecture, we will explore the syntax of the COUNT function and provide examples using demo data.

Syntax:
The syntax for the COUNT function is as follows:

=COUNT(value1, [value2], …)

The COUNT function can accept one or more arguments, separated by commas. Each argument represents a range or value that you want to count.

Examples:

Example 1:
Let’s consider a simple example where we have a list of students and their respective test scores. We want to count the number of students who scored above 80.

| A | B |
|——–|———|
| Name | Score |
| John | 75 |
| Sara | 92 |
| Mark | 81 |
| Emma | 78 |
| David | 86 |

COUNT

COUNT(value1, value2, …)

  • value1, value2, …: These are the values or ranges that you want to count. You can include up to 255 arguments, which can be individual cells, cell references, or ranges separated by commas.

Note: The COUNT function ignores any text or empty cells within the specified range. It only considers cells that contain numbers or dates.

COUNT(A2:B6)

This formula counts the number of cells within the range A2:B6 that contain numeric values.

It returns the value 5 which is the number of numerical values in the range.

COUNTIF

To count the number of students who scored above 80, we can use the COUNT function as follows:

=COUNTIF(B2:B6, “>80”)

Explanation:
– B2:B6: This represents the range of cells containing the scores.
– “>80”: This is the criteria we want to apply, i.e., scores greater than 80.

The COUNTIF function counts the number of cells within the specified range (B2:B6) that meet the given criteria (>80).

Result: The COUNTIF function will return the value 3 since there are three students who scored above 80.

Example 2:

COUNTA

Now, let’s consider a scenario where we have a dataset with missing values represented by blank cells. We want to count the number of non-blank cells in a given range.

| A | B |
|——–|———|
| Name | Score |
| John | 75 |
| Sara | |
| Mark | 81 |
| Emma | |
| David | 86 |

To count the number of non-blank cells in the range B2:B6, we can use the COUNTA function as follows:

=COUNTA(B2:B6)

Explanation:
– B2:B6: This represents the range of cells for which we want to count the non-blank cells.

The COUNTA function counts the number of non-blank cells within the specified range (B2:B6).

Result: The COUNT function will return the value 3since there are three non-blank cells in the range.

Microsoft Excel Certification Traininig

Why learn Excel?

7 tools every Excel user must know

10 Excel Functions you must know

8th Floor ZB Chambers
15 George Silundika Avenue,
Harare, Harare 263
Zimbabwe
Phone: 0719397464

Uncovering Patterns: Exploratory Data Analysis in Action

Uncovering patterns : Exploratory data analytics

Uncovering Patterns: Exploratory Data Analysis in Action

In the world of data science, exploratory data analysis (EDA) is a critical first step in any data analysis project. EDA is the process of inspecting, cleaning, and exploring data with the goal of discovering patterns and trends. By understanding the data, analysts can better ask questions, build models, and make predictions.

There are many different techniques that can be used for EDA, but some of the most common include:

Visualization: Creating charts and graphs to visualize the data can help to identify patterns and trends that may not be obvious from looking at the raw data.

Statistical analysis: Using statistical tests to measure the relationships between different variables can help to identify significant patterns.

Data mining: Using data mining algorithms to identify patterns and trends in large datasets can be helpful when the data is too complex to analyse manually.

Uncovering patterns : Exploratory data analytics in action

EDA is an iterative process, meaning that it is often necessary to repeat the steps of inspection, cleaning, and exploration as new insights are gained. By continually exploring the data, analysts can uncover hidden patterns and trends that can lead to valuable insights.

Here are some examples of how EDA has been used to uncover patterns in data:

  • A marketing analyst used EDA to identify that a particular product was being purchased more often by customers who lived in urban areas. This information could be used to target marketing campaigns more effectively.
  • A financial analyst used EDA to identify that the stock price of a particular company was correlated with the price of oil. This information could be used to make predictions about the future performance of the stock.
  • A healthcare researcher used EDA to identify that patients who were prescribed a particular medication were more likely to experience certain side effects. This information could be used to improve the safety of the medication.

These are just a few examples of how EDA can be used to uncover patterns in data. By understanding the data, analysts can make better decisions and improve the outcomes of their projects.

If you are interested in learning more about EDA, there are many resources available online and in libraries. There are also many data science courses that offer instruction on EDA. With a little effort, you can learn how to use EDA to uncover patterns in your own data. At Data Analytics Training and Advisory Services we train you to master the tools that you require to perform EDA.

Contact us to find out more

Microsoft Excel certification exam MO-210

Microsoft Excel Training Courses

Data Analyst Training Course Programme

Financial Modelling Using Excel Training Course

8th Floor ZB Chambers
15 George Silundika Avenue,
Harare, Harare 263
Zimbabwe
Phone: 0719397464

Data Science vs. Data Analytics: What’s the Difference?

Data Science vs. Data Analytics: What's the Difference?

Data Science vs. Data Analytics: What’s the Difference?

Data science and data analytics are two of the most in-demand fields in today’s job market. Both disciplines involve working with data, but they have different goals and use different techniques.

Data science is a broad field that encompasses the collection, analysis, interpretation, and visualization of data. Data scientists use a variety of tools and techniques to extract insights from data, including machine learning, statistical analysis, and natural language processing. Data scientists are often involved in developing new products and services, improving business processes, and making strategic decisions.

Data analytics is a more focused field that focuses on the analysis of data to identify trends, patterns, and relationships. Data analysts use a variety of tools and techniques to clean, transform, and analyze data, and they often use visualization tools to communicate their findings to stakeholders. Data analysts are often involved in solving business problems, making recommendations, and improving decision-making.

Here is a table that summarizes the key differences between data science and data analytics:

Data Science Data Analytics
Broader field More focused field
Uses a variety of tools and techniques Uses a more limited set of tools and techniques
Focuses on extracting insights from data Focuses on identifying trends, patterns, and relationships in data
Often involved in developing new products and services, improving business processes, and making strategic decisions Often involved in solving business problems, making recommendations, and improving decision-making

It is important to note that the terms “data science” and “data analytics” are often used interchangeably. This is because the two fields are closely related and there is a lot of overlap between them. However, it is important to understand the distinctions between the two fields in order to make informed career choices and to communicate effectively with data scientists and data analysts.

The Future of Data Science and Data Analytics

The demand for data scientists and data analysts is expected to grow significantly in the coming years. This is due to the increasing amount of data being generated by businesses and individuals, as well as the growing need for businesses to use data to make better decisions.

If you are interested in a career in data science or data analytics, there are a few things you can do to prepare. First, you should develop strong skills in mathematics, statistics, and programming. You should also be familiar with a variety of data analysis tools and techniques. Additionally, you should be able to communicate effectively with both technical and non-technical audiences.

With the right skills and training, you can have a successful career in data science or data analytics. These are exciting fields that are at the forefront of innovation, and they offer the opportunity to make a real impact on the world.

Data Analytics Training and Advisory Services offers you the the opportunity to master the skills required to be a successful data analyst and get internationally recognised certification.

Contact us to get started with DATA ANALYTICS TRAINING

Microsoft Excel certification exam MO-210

Essential skills for data analysts

7 tools every Excel user must know

8th Floor ZB Chambers
15 George Silundika Avenue,
Harare, Harare 263
Zimbabwe
Phone: 0719397464
Email: info@dataanalysis.co.zw

The easiest way to qualify as a data analyst

easiest way to qualify as a Data analyst

The easiest way to qualify as a data analyst

There is no one-size-fits-all answer to this question, as the easiest way to qualify as a data analyst will vary depending on your individual circumstances and experience. However, some general tips that may help you qualify as a data analyst include:

Obtain a relevant degree

A bachelor’s degree in a field such as statistics, computer science, or mathematics is a good starting point for a career in data analysis. However, there are also many online courses and boot camps that can teach you the skills you need to become a data analyst.

Gain experience

Internships and entry-level data analyst positions can give you valuable experience in the field. If you don’t have any experience, you can also start by volunteering your data analysis skills to a local organization.

Develop your skills

There are many resources available to help you develop your data analysis skills. You can take online courses, read books, and attend conferences. You can also practice your skills by working on data analysis projects.

Build a portfolio

A portfolio of your data analysis work is a great way to showcase your skills to potential employers. Be sure to include projects that demonstrate your ability to collect, clean, analyze, and visualize data.

Network

Networking with other data analysts is a great way to learn about new opportunities and get your foot in the door. Attend industry events, join online forums, and connect with data analysts on LinkedIn.

By following these tips, you can increase your chances of qualifying as a data analyst.

Here are some additional tips that may help you qualify as a data analyst:

  • Be proficient in data analysis software. There are many different data analysis software programs available, such as SAS, SPSS, and R. Be sure to become proficient in one or more of these programs.
  • Be able to communicate effectively. Data analysts must be able to communicate their findings to both technical and non-technical audiences. Be sure to develop your communication skills, both written and verbal.
  • Be creative and innovative. Data analysts must be able to think outside the box and come up with new ways to analyze data. Be sure to develop your creativity and problem-solving skills.

If you are interested in a career in data analysis, be sure to start by learning the essential skills and knowledge. With hard work and dedication, you can become a successful data analyst.

Essential skills for data analysts

10 Excel Functions you must know

10 Excel shortcuts you must know

Training Courses

8th Floor ZB Chambers
15 George Silundika Avenue,
Harare, Harare 263
Zimbabwe
Phone: 0719397464
Email: info@dataanalysis.co.zw

Microsoft Excel certification exam MO-210

Microsoft logo

Microsoft Excel certification exam MO-210

Microsoft Excel certification exam MO-210 is a Microsoft Office Specialist (MOS) exam that measures a candidate’s ability to use Microsoft Excel 2022 and later to create and manage worksheets and workbooks, create cells and ranges, create tables, apply formulas and functions, and create charts and objects.

The exam is 120 minutes long and consists of 75 multiple-choice questions. The passing score is 700.

Exam requirements

To be successful on the exam, candidates should have the following skills:

  • Create and manage worksheets and workbooks
  • Create cells and ranges
  • Create tables
  • Apply formulas and functions
  • Create charts and objects

Candidates can prepare for the exam by taking a Microsoft-approved training course or by using self-study resources such as books, online tutorials, and practice exams.

The exam fee is $100.

The Microsoft Excel certification exam MO-210 is a valuable credential for anyone who wants to demonstrate their skills in using Microsoft Excel. The certification can help candidates improve their job prospects and earn higher salaries.

Benefits of taking the exam

Here are some of the benefits of getting certified in Microsoft Excel:

  • Increased job opportunities: Employers are increasingly looking for employees with Microsoft Excel skills. Certification can help you stand out from the competition and increase your chances of getting hired.
  • Higher salaries: Certified Microsoft Excel professionals earn higher salaries than non-certified professionals. According to a study by PayScale, the average salary for a certified Microsoft Excel professional is $80,000 per year.
  • Improved career prospects: Certification can help you advance your career and take on more challenging and rewarding roles.
  • Increased confidence: Certification can give you the confidence you need to use Microsoft Excel effectively in your work.

If you are interested in getting certified in Microsoft Excel, I encourage you to check out the Microsoft Excel certification exam MO-210. It is a valuable credential that can help you improve your job prospects, earn higher salaries, and advance your career.

At Data Analytics Training and Advisory Services we offer training to prepare you for the MO 210 Examinantion. Our training is designed to help you pass without much fuss.

Contact us to enrol for training

    8th Floor ZB Chambers
    15 George Silundika Avenue,
    Harare, Harare 263
    Zimbabwe
    Phone: 0719397464

    Microsoft Excel Certification Training

    Why learn Excel?

    10 Excel Functions you must know

    7 tools every Excel user must know

    Essential skills for data analysts

    Essential skills for data analysts

    Essential skills for data analysts

    Essential skills for data analysts are discussed here to help you with your journey to become a data analyst. Whichever method you choose to study the complete breadth of data analytics skills, there is a foundational set of knowledge you must possess. Data analysts must be skilled in a specific set of abilities because they work with a lot of data every day.
    Technical abilities that a data analyst should possess include:

    Structured Query Language (SQL)

    SQL is a database language used for handling large datasets that can’t be handled in Excel. It’s ideal for managing and storing data, and relating multiple databases, among other things.

    Data Visualization

    Data visualization refers to the skill of presenting the findings of data in the form of graphics and illustrations.

    Data Cleaning

    Data cleaning is one of the most crucial steps while compiling machine learning models. A dataset that’s thoroughly cleaned and organized can even beat fancy algorithms.

    Python

    Python is a high-level programming language that offers a plethora of specialized libraries, all are related to artificial intelligence.

    Machine Learning

    There are numerous new AI and predictive analytics applications being developed in the data science community. For data analysts, machine learning expertise has essentially become a need.

    Our blog is full with useful material if you still want to learn more about the topic of data analytics before taking any further steps. Learn everything you need to know before deciding if this is the correct field for you. We’ve already done the hard work for you.

    Here are some more articles you can read:

    Jobs where Excel skills will pay you handsomely

    7 tools every Excel user must know

    10 Excel Functions you must know

    10 principles of data-driven companies

    Microsoft Excel Training Courses

    This blog post was written by Brian Johnknox Muyambo, Principal Consultant at Data Analytics Training and Advisory Services.

    8th Floor ZB Chambers
    15 George Silundika Avenue,
    Harare, Harare 263
    Zimbabwe
    Phone: 0719397464
    Email: info@dataanalysis.co.zw


    Why learn Excel?

    Why learn Excel?

    Why learn Excel?

    Why learn Excel in the first place? Microsoft Excel training courses have become increasingly popular in recent years due to the growing need for users to be able to understand and use the software proficiently. Enrolling in formal training helps you learn the different elements faster than if you discover them as you go. Learning how to use Microsoft Excel not only allows you to carry out complex data analysis more quickly and accurately, but also saves you time on other tasks such as creating spreadsheets or graphs.

    Boosting your resume

    Furthermore, the knowledge you gain from formal training courses can also help boost your resume, showing potential employers that you have a strong understanding of computer software. With the range of benefits that come with taking a Microsoft Excel training course, it is easy to see why such courses are becoming increasingly popular. This is particularly true in the current technological climate, where most employers prefer applicants to have at least a basic understanding of computer software.

    Practical skills

    Taking a Microsoft Excel course not only allows you to create complex data analysis faster and more accurately, but also gives you the ability to quickly and efficiently create spreadsheets or graphs. Having a comprehensive knowledge of the Microsoft Excel software can thus prove to be very beneficial for potential employees, since it allows them to demonstrate their skills and competence in data management.

    Productivity

    Additionally, mastering the use of Microsoft Excel is not just advantageous for prospective employees; it is also beneficial for those who are already employed. Being able to effectively utilize the Microsoft Excel software can help employees better manage their data, improve their workflow and productivity, and stay ahead of the curve. It can also give employers confidence in their employee’s ability to successfully handle large data sets and keep up with the latest technology. Therefore, having a deep understanding of the Microsoft Excel software is an invaluable asset in today’s professional environment.


    10 Excel Functions you must know

    10 Excel shortcuts you must know

    10 principles of data-driven companies

    10 Excel Functions you must know

    10 Excel functions you must know

    10 Excel Functions You Must Know

    10 Microsoft Excel functions you must know:

    (1) XLOOKUP

    (2) Wildcards

    (3) Sparklines

    (4) Filter

    (5) Pivot Tables

    (6) IF

    (7) SUMIFS

    (8) COUNTIFS

    (9) Transpose

    (10) TRIM

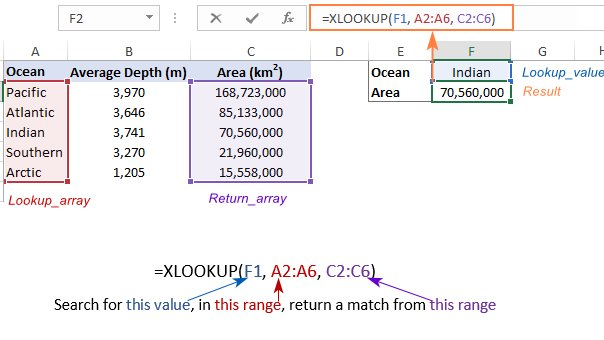
    (1) XLOOKUP:

    XLookup is an upgrade compared to VLOOKUP or Index & Match.

    Use the XLOOKUP function to find things in a table or range by row.

    Formula: =XLOOKUP (lookup value, lookup array, return array)

    XLOOKUP

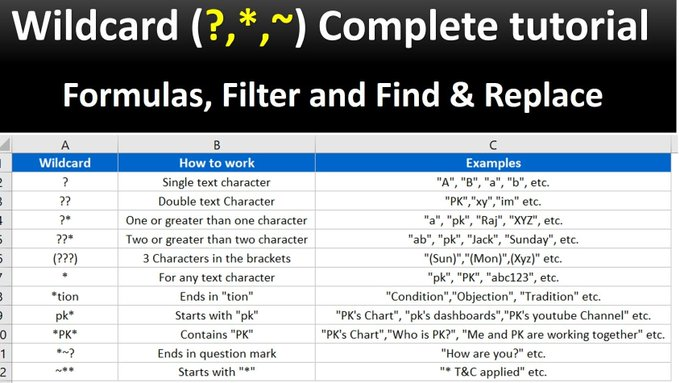
    (2) Wildcards:

    A wildcard is a special character that allows you to perform partial matches in your Excel formulas. Excel has three wildcards: • asterisk “*” • question mark “?” • tilde “~”


    WILDCARD

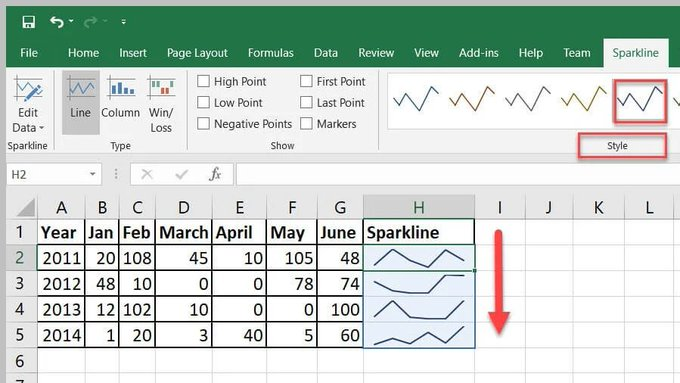
    (3) Sparklines:

    Sparklines allow you to insert mini graphs inside a cell to provide a visual representation of data. Use sparklines to show trends or patterns in data. On the ‘Insert tab’, click ‘Sparklines’

    SPARKLINES

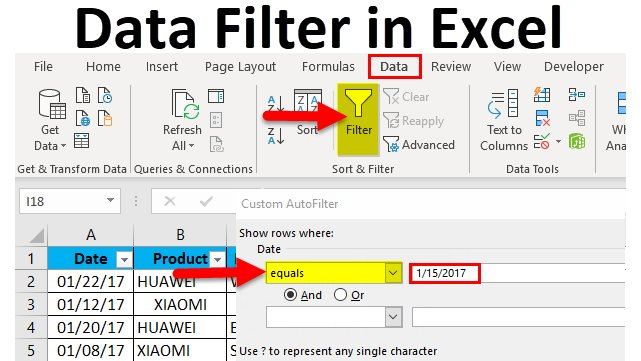
    (4) Filter:

    The FILTER function allows you to filter data based on a query. For example, you can filter a column to show a specific product or date.

    You can also sort in ascending or descending order.

    The shortcut for this function is CTRL + SHFT + L


    FILTER

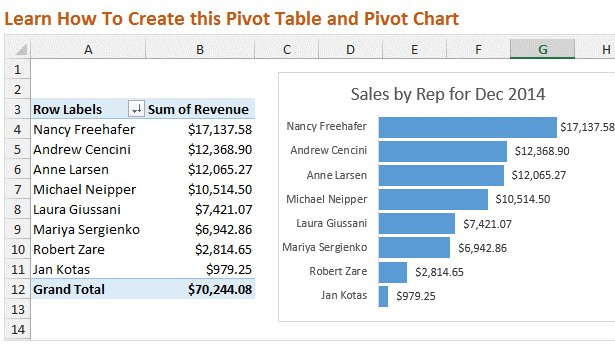
    5) Pivot Tables:

    A powerful tool to calculate, summarize & analyze data, which allows you to compare or find patterns & trends in data. To access this function, go to “Insert” in the Menu bar, and then select “Pivot Table”

    PIVOT TABLES

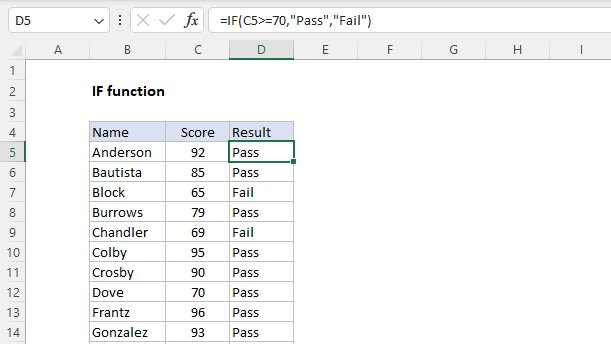
    (6) IF:

    The IF function makes logical comparisons & tells you when certain conditions are met.

    For example, a logical comparison would be to return the word “Pass” if a score is >70, and if not, it will say “Fail” An example of this formula would be =IF(C5>70,”Pass”,”Fail”)

    IF FUNCTION

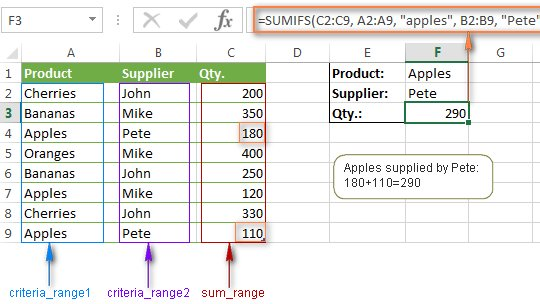
    (7) SUMIFS:

    SUMIFS sum the values in a range that meet multiple criteria.

    For example, use it if you want the sum of two criteria, for example, Apples from Pete. The formula is SUMIFS (sum_range, criteria_range1, criteria1, [criteria_range2, criteria2], …)

    SUMIFS

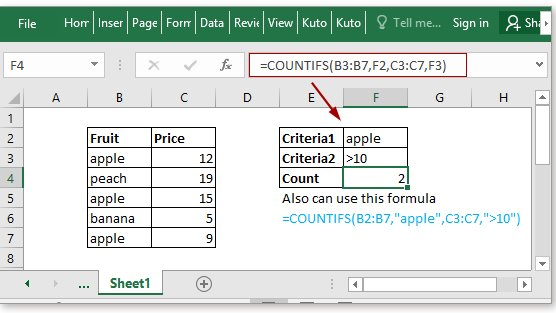
    (8) COUNTIFS:

    CountIf counts the number of times a criteria is met. For example, it counts the number of times that both (1) apples and (2) price > $10, are mentioned.
    COUNTIFS

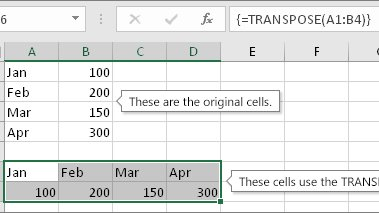
    (9) Transpose:

    This will transform items in rows, to instead be shown in columns or vice versa.
    To transpose a column to a row: • Select the data in the column • Select the cell you want the row to start • Right click, choose to paste special, select transpose
    TRANSPOSE

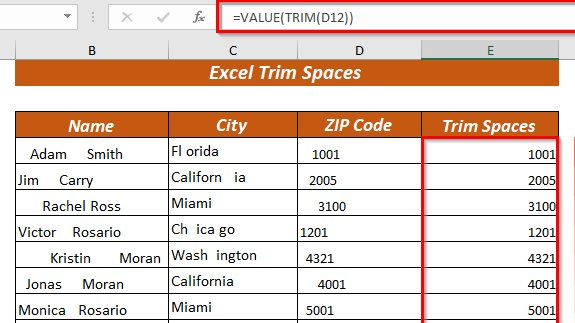
    (10) TRIM:

    TRIM removes the extra spaces in data.
    TRIM can be useful in removing irregular spacing from imported data =TRIM()
    TRIM

    7 tools every Excel user must know
    10 Excel shortcuts you must know

    Jobs where Excel skills will pay you handsomely