How AI Is Revolutionising Customer Experience in Business

How Generative AI Is Revolutionising Customer Experience in Business

How AI Is Revolutionising Customer Experience in Business

In today’s rapidly digitizing world, businesses are constantly looking for ways to elevate customer experience (CX), not just to meet expectations, but to anticipate and exceed them. Among the most powerful tools reshaping this space is Generative AI, a category of artificial intelligence that creates content, conversation, design, and decision support in real time.

From customer service to product design, generative AI is not just enhancing efficiency, it’s redefining how businesses engage with people.

What is Generative AI?

Generative AI refers to systems capable of creating original outputs , text, images, audio, video, and even code, based on patterns learned from vast datasets. Tools like ChatGPT, DALL·E, and Google’s Gemini are examples of generative AI platforms that can simulate human-like creativity and reasoning at scale.

Why Customer Experience Matters More Than Ever

In an era of commoditized products and abundant choices, experience is what differentiates a brand. Research shows that companies that lead in customer experience outperform their competitors in terms of revenue growth and customer retention. The key challenge? Delivering consistent, personalized, and high-quality service across multiple channels.

How Generative AI is Transforming CX

1. Hyper-Personalized Interactions

Generative AI can instantly generate customer-specific responses based on purchase history, browsing behavior, or real-time context. Imagine a chatbot that remembers a customer’s last inquiry, offers tailored product recommendations, and adjusts its tone to match the customer’s communication style, all autonomously.

2. 24/7 Intelligent Customer Support

Traditional chatbots were rule-based and often frustrating. Now, AI-powered virtual agents can handle complex queries, escalate issues when necessary, and even simulate empathy, providing a more humanized support experience without the wait times.

3. Smarter Product Descriptions and Content

Generative AI can dynamically generate product descriptions, marketing emails, and FAQs that match a user’s preferences. This allows e-commerce businesses, for example, to speak directly to different personas without manually rewriting content.

4. Voice and Visual AI Interfaces

AI voice assistants are becoming more natural and responsive. Meanwhile, image-based AI can help customers “try on” clothes virtually, scan real-world objects for information, or design custom furniture with a prompt. These features merge AI creativity with real customer value.

5. Real-Time Feedback and Sentiment Analysis

Generative AI can sift through customer reviews, social media mentions, and support tickets to identify pain points and recommend service improvements. It doesn’t just collect data, it interprets and translates it into actionable insights.

Challenges and Ethical Considerations

Despite its promise, the rise of generative AI brings challenges:

  • Bias and hallucinations: AI can generate misleading or biased content if not trained responsibly.
  • Privacy concerns: Handling customer data must comply with global data protection standards (e.g., GDPR, POPIA).
  • Human touch: While AI enhances scale, human oversight is essential in emotionally sensitive or high-stakes interactions.

Businesses must blend automation with empathy, and use AI to enhance human capabilities, not replace them.

Looking Ahead: Augmented CX Teams

The future is likely to see hybrid teams where humans and AI collaborate seamlessly. Generative AI will handle repetitive and predictive tasks, freeing up employees to focus on creativity, strategic thinking, and building relationships.

Companies that invest in AI literacy, ethical frameworks, and customer-centric design today will be the CX leaders of tomorrow.

Conclusion

Generative AI is not just a trend, it’s a foundational shift in how businesses can deliver value. Those who embrace it thoughtfully and strategically will redefine what’s possible in customer experience.

Are you ready to unlock the full potential of AI in your business?

Need help integrating AI into your customer experience strategy? Contact us for a consultation.

Please enable JavaScript in your browser to complete this form.
Name

How Generative AI is Transforming Business in 2025

Artificial Intelligence (AI) Training Courses

How AI is Revolutionizing Weather Forecasting?

Data security in collaborative data analytics

8th Floor ZB Chambers
15 George Silundika Avenue,
Harare, Harare 263
Zimbabwe
Phone: 0719397464
Email: info@dataanalysis.co.zw

kampungbet

kampungbet

kampungbet

How Generative AI is Transforming Business in 2025

How Generative AI is Transforming Business in 2025

How Generative AI is Transforming Business in 2025

In 2025, artificial intelligence (AI) is no longer a futuristic concept, it’s a present-day powerhouse, reshaping how businesses operate, compete, and grow. At the heart of this transformation is generative AI, a technology that enables machines to create content, code, designs, forecasts, and even strategies, with unprecedented speed and scale.

What Is Generative AI?

Generative AI refers to AI models that can generate new content based on training data. Tools like ChatGPT, DALL·E, Claude, and Google’s Gemini are leading examples. These models use large datasets and advanced algorithms to produce human-like text, images, audio, video, and more.

But beyond creative tasks, generative AI is rapidly becoming a strategic asset across nearly every sector of the economy.

1. Content Creation and Marketing

In content-driven industries, generative AI has drastically reduced the time and cost of producing marketing assets. Businesses now use AI to:

  • Write blogs, product descriptions, and ad copy
  • Create social media content and schedules
  • Generate customer personas and campaign ideas
  • Translate and localize content in multiple languages

The result? Marketing teams are shifting from content creation to content curation and strategy.

2. Customer Service and Sales

AI chatbots and virtual assistants are handling millions of customer interactions with increased empathy and contextual understanding. Sales teams are leveraging AI to:

  • Write personalized email outreach
  • Generate follow-up messages
  • Analyze leads and prioritize prospects
  • Simulate customer objections and responses

This enables real-time engagement and improved customer satisfaction without increasing human labor costs.

3. Product Design and Development

Generative AI is revolutionizing how companies innovate:

  • Designers use AI to generate product mockups and prototypes
  • Engineers co-create code using AI coding assistants
  • Auto manufacturers use AI to simulate designs and performance
  • Pharmaceutical companies use AI to generate molecular structures for drug discovery

It’s not just faster—it’s smarter, often surfacing options humans wouldn’t have considered.

4. Data Analysis and Decision-Making

AI is no longer just a tool for analysis—it’s a partner in thinking. Executives use AI to:

  • Generate dashboards and summaries from complex data
  • Create business forecasts based on historical and real-time inputs
  • Simulate “what-if” scenarios for strategic planning

This democratizes data insights, empowering non-technical users to make data-driven decisions.

5. Risk Management and Compliance

In finance, insurance, and legal industries, AI is improving regulatory compliance and risk detection. AI models can:

  • Review and draft contracts
  • Identify patterns of fraud
  • Flag unusual financial transactions
  • Generate audit-ready documentation

AI doesn’t just protect the business—it makes it more agile in the face of risk.

Challenges to Consider

As with any transformative technology, generative AI poses risks:

  • Bias and misinformation: AI can reflect the biases in its training data.
  • Job displacement: While AI augments many roles, some repetitive jobs are at risk.
  • Data privacy: Businesses must carefully manage how they use customer data in training models.
  • Dependence: Overreliance on AI without human oversight can be dangerous.

Smart businesses are addressing these through AI governance policies and human-in-the-loop strategies

Looking Ahead

The future of business belongs to those who can blend human creativity with AI-powered productivity. Generative AI is not replacing professionals, it’s empowering them. In 2025, forward-thinking companies are not asking “Should we use AI?” but rather “How can we best use AI responsibly and competitively?”

Whether you’re a startup founder, marketing director, operations manager, or CEO, embracing AI is no longer optional. It’s your edge.

Want to learn more about integrating AI into your business strategy? Let’s connect.
#AIinBusiness #GenerativeAI #FutureofWork #Innovation

How AI is Revolutionizing Weather Forecasting?

10 principles of data-driven companies

AI for Business Professionals Training Course

Artificial Intelligence (AI) Training Courses

8th Floor ZB Chambers
15 George Silundika Avenue,
Harare, Harare 263
Zimbabwe
Phone: 0719397464
Email: info@dataanalysis.co.zw

kampungbet

kampungbet

kampungbet

Wide Data vs Long Data: Why Format Matters More Than You Think

wide data vs long data

Wide Data vs Long Data: Why Format Matters More Than You Think

In the world of data analytics, the conversation often revolves around data quality, volume, and modeling techniques.
Yet one crucial and often overlooked factor quietly shapes the success or failure of many projects: data structure.

At the heart of this is the choice between two fundamental formats — wide data and long data.

While this might sound like a minor technical distinction, choosing the right format for your task can dramatically affect your ability to clean, analyze, visualize, and model your data effectively.

In this post, we explore what wide and long data formats are, when to use each, and why mastering this distinction is key for modern data professionals.

What Is Wide Data?

Wide data refers to datasets where each entity (such as a customer, patient, or product) has a single row, and each variable or measurement occupies its own column.

Each new measurement generates a new column, not a new row.

Example:
Imagine a survey with 10 questions. In wide format, each respondent would have a row, and each question would have its own column:

Respondent ID Q1 Q2 Q3 Q10
001 4 5 2 3
002 3 4 1 5

Wide data is typically used when:

  • You need each observation (person, item) on a single line for machine learning models.
  • You’re building dashboards that summarize metrics across many variables at once.
  • You want rapid aggregation or descriptive reporting (e.g., averages, counts).

Advantages:

  • Simple structure for static reporting.
  • Easy to understand when the number of variables is small.
  • Preferred by many traditional machine learning algorithms (e.g., decision trees, linear regression models).

Disadvantages:

  • Becomes unwieldy with many repeated measures (e.g., time series across multiple dates).
  • Harder to reshape for flexible analysis or advanced statistical modeling.

What Is Long Data?

Long data (sometimes called “tidy” data) organizes the same entity across multiple rows.
Each row represents a single measurement or event tied to an entity and a variable type.

Example:
Instead of having one row per respondent, you have one row per respondent per question:

Respondent ID Question Response
001 Q1 4
001 Q2 5
001 Q3 2
002 Q1 3
002 Q2 4
002 Q3 1

Long data is typically used when:

  • You need to track events or measurements over time (e.g., monthly sales per store).
  • You want to perform group-wise comparisons or time-series analysis.
  • You’re preparing data for advanced statistical models (e.g., mixed models, generalized estimating equations).
  • You’re using data visualization tools that expect data in tidy format (e.g., ggplot2 in R, matplotlib in Python).

Advantages:

  • Very flexible for grouping, filtering, and modeling.
  • Essential for handling repeated measures or time-based data.
  • Works better for complex analysis, including trend analysis and panel data models.

Disadvantages:

  • Requires more data manipulation for certain kinds of summary reporting.
  • Not as intuitive for casual users who expect “one row per subject.”

Why Does Data Format Matter?

Choosing the wrong data structure can make even simple analysis painfully complicated.
Worse, it can introduce errors into reporting, visualizations, and models.

Some real-world consequences of poor format choices include:

  • Time-consuming manual reshaping that could have been avoided.
  • Incorrect aggregations leading to flawed insights.
  • Struggles with software that expects data in a different format (e.g., Power BI expects “long” format for proper drill-down visuals).

Moreover, many machine learning pipelines require wide data, whereas statistical models used in social sciences or longitudinal studies prefer long data.

Good data scientists, analysts, and business intelligence professionals don’t just clean data — they reshape it appropriately for the questions they want to answer.

Wide vs Long Data: Quick Summary

Aspect Wide Format Long Format
Structure One row per subject; multiple columns for variables Multiple rows per subject; one column for variable type
Best for Machine learning, dashboard summaries, simple reporting Time series, panel data, flexible analysis, visualizations
Pros Easy for some models and reports More flexible, scalable, tidy
Cons Becomes unwieldy with time-based or repeated data Requires more initial data manipulation

When in Doubt: Structure for Analysis

The best practice is not to structure your data based on how it was collected, but based on how it will be analyzed.

  • If you need easy dashboarding or quick summaries, wide might be best.
  • If you need detailed comparisons, dynamic visualizations, or advanced modeling, go long.

Often, smart data practitioners set up pipelines that allow data to flow between wide and long formats seamlessly — using tools like R’s pivot_longer/pivot_wider, Python’s melt/pivot, or even Excel’s Power Query.

In other words:
🔹 Shape your data to serve your analysis — not the other way around.

Conclusion

Understanding the difference between wide and long data is not just a technical skill — it’s a mindset.

In an era where data-driven decisions are make-or-break for businesses, those who can skillfully reshape, restructure, and rethink data will have the real competitive advantage.

Before you jump into your next project, ask yourself:
Is my data in the best format for the questions I want to answer?

Data security in collaborative data analytics

Demystifying Data: The Power of Data Storytelling

Marketing Analytics: From Buzzword to Business Booster

CONTACT US:

Please enable JavaScript in your browser to complete this form.
Name

8th Floor ZB Chambers
15 George Silundika Avenue,
Harare, Harare 263
Zimbabwe
Phone: 0719397464
Email: info@dataanalysis.co.zw

kampungbet

kampungbet

kampungbet

kampungbet

kampungbet

kampungbet

Data security in collaborative data analytics

collaborative data analytics security

Data Security in Collaborative Data Analytics

In today’s data-driven world, businesses rely heavily on collaborative data analytics to make informed decisions. However, sharing and analyzing data across teams, departments, and even organizations come with security risks that must be managed effectively. Ensuring data security in collaborative environments is crucial to maintaining trust, compliance, and operational integrity. Here’s how businesses can safeguard their data while enabling effective collaboration.

1. Implement Role-Based Access Control (RBAC)

Not everyone in a collaborative environment needs the same level of access to data. Role-Based Access Control (RBAC) ensures that employees only have access to the data necessary for their specific roles. By limiting exposure, organizations reduce the risk of unauthorized data use and breaches.

2. Use Data Encryption for Protection

Encryption is a critical security measure that protects data during transmission and storage. End-to-end encryption ensures that even if data is intercepted, it remains unreadable to unauthorized parties. Secure Socket Layer (SSL) protocols, Virtual Private Networks (VPNs), and encrypted databases help maintain the integrity and confidentiality of shared data.

3. Maintain Data Anonymization and Masking

To minimize risk, businesses can use data anonymization and masking techniques. Anonymization removes personally identifiable information (PII), ensuring that data remains useful for analysis without compromising privacy. Masking replaces sensitive data with fictional yet realistic values, allowing analysts to work with data without exposing critical information.

4. Implement Secure Collaboration Platforms

Organizations should use secure data analytics platforms that include built-in security measures such as multi-factor authentication (MFA), access logs, and automatic alerts for suspicious activities. Platforms like Microsoft Azure, Google Cloud, and AWS offer security-centric solutions for collaborative analytics.

5. Regularly Audit and Monitor Data Access

Continuous monitoring and auditing of data access help detect anomalies and prevent potential breaches. Automated logging systems can track who accessed data, when, and for what purpose. Organizations should establish protocols for reviewing access logs and identifying suspicious activities.

6. Establish Clear Data Governance Policies

Data governance policies define how data is collected, stored, shared, and protected. These policies should outline best practices, compliance requirements, and employee responsibilities in handling data. Having a well-structured governance framework ensures consistency and accountability in data security practices.

7. Train Employees on Security Best Practices

Human error is one of the most common causes of data breaches. Regular training programs should educate employees on recognizing phishing attempts, securing credentials, and following security protocols. A well-informed workforce plays a crucial role in maintaining data security.

8. Utilize Blockchain for Data Integrity

Blockchain technology can enhance security in collaborative data analytics by providing a tamper-proof ledger of transactions. This decentralized approach ensures that data modifications are transparent and verifiable, reducing the risk of fraud or unauthorized changes.

9. Ensure Compliance with Regulatory Standards

Organizations must adhere to industry-specific data security regulations such as GDPR, HIPAA, or CCPA. Compliance ensures that data handling meets legal requirements and minimizes exposure to penalties and reputational damage.

10. Adopt Zero-Trust Security Principles

Zero-trust security assumes that no user or system is inherently trustworthy. It requires continuous verification of identities, strict access controls, and least-privilege access principles. By implementing zero-trust, organizations strengthen their defenses against internal and external threats.

Conclusion

Collaborative data analytics offers immense benefits, but without proper security measures, it can expose organizations to significant risks. By implementing access controls, encryption, secure platforms, and governance policies, businesses can foster a secure data-sharing environment. The key is to balance accessibility with security, ensuring that teams can collaborate effectively without compromising sensitive information.

AI for Data Analysts Training Course

Demystifying Data: The Power of Data Storytelling

Marketing Analytics: From Buzzword to Business Booster

The easiest way to qualify as a data analyst

8th Floor ZB Chambers
15 George Silundika Avenue,
Harare, Harare 263
Zimbabwe
Phone: 0719397464

kampungbet

kampungbet

kampungbet

kampungbet

kampungbet

kampungbet

kampungbet

kampungbet

Contemporary Trends in Data Analytics: Shaping the Future of Decision-Making

Analytics

Contemporary Trends in Data Analytics: Shaping the Future of Decision-Making

In today’s rapidly evolving digital landscape, data analytics has become a cornerstone of informed decision-making. Businesses, governments, and individuals rely on data-driven insights to make strategic moves, optimize processes, and predict future trends. As data grows in volume, velocity, and variety, new trends in analytics are emerging to meet the challenges and opportunities of our modern world. Here’s a look at some of the most significant contemporary trends shaping the field of data analytics.


1. Artificial Intelligence and Machine Learning Integration

AI and machine learning (ML) are no longer optional tools for analytics—they’re essential. These technologies enable predictive analytics, allowing businesses to anticipate future outcomes based on historical data. AI-powered systems can analyze large datasets at unprecedented speeds, identify patterns, and make real-time decisions, empowering industries such as healthcare, finance, and retail.

Example:

Retailers use AI to personalize customer experiences by analyzing buying behaviors and recommending products. This trend enhances customer satisfaction and drives revenue growth.


2. Real-Time Analytics

In a world where speed is critical, real-time analytics has become a game-changer. Organizations now expect instantaneous insights to respond to events as they happen. Real-time analytics is particularly impactful in industries like e-commerce, where dynamic pricing and inventory management are crucial, or in finance, where fraud detection requires immediate action.

Key Drivers:

  • IoT devices
  • Streaming data platforms like Apache Kafka
  • Cloud computing advancements

3. Data Democratization

Data analytics is no longer confined to data scientists and IT professionals. Tools like Tableau, Power BI, and Looker are making analytics accessible to non-technical users. This trend, known as data democratization, empowers employees across all levels of an organization to make data-informed decisions without needing specialized expertise.

Impact:

Data democratization fosters a culture of data-driven decision-making and reduces bottlenecks in data analysis.


4. Focus on Data Privacy and Ethics

With the increasing use of data comes heightened concerns about privacy and ethical implications. Regulations like GDPR and CCPA emphasize the importance of protecting user data. Companies are now focusing on building transparent data practices, ensuring compliance, and adopting privacy-preserving techniques like differential privacy and federated learning.

Trend Insights:

Organizations must balance analytics innovation with ethical responsibilities to maintain trust and avoid regulatory penalties.


5. Edge Analytics

As IoT devices proliferate, edge analytics has gained prominence. Instead of sending all data to centralized systems for analysis, edge computing processes data locally, at or near the source. This approach reduces latency, improves efficiency, and enables faster decision-making.

Applications:

  • Autonomous vehicles analyzing sensor data in real-time
  • Smart factories optimizing production processes instantly

6. Augmented Analytics

Augmented analytics leverages AI to enhance the entire analytics process, from data preparation to insight generation. Natural language processing (NLP) and conversational interfaces allow users to interact with data intuitively, asking questions and receiving answers in plain language.

Benefits:

  • Streamlined workflows
  • Reduced dependency on technical expertise
  • Accelerated time-to-insight

7. Hyperautomation in Data Analytics

Hyperautomation, the use of advanced technologies like AI, ML, and RPA (robotic process automation), is revolutionizing analytics workflows. By automating repetitive tasks such as data cleansing, integration, and reporting, organizations can focus more on strategic analysis and innovation.

Example:

Financial institutions are automating risk assessment processes to improve accuracy and reduce human bias.


8. Cloud-Native Analytics

The shift to cloud-native solutions is accelerating as businesses prioritize scalability, flexibility, and cost-efficiency. Cloud platforms like AWS, Google Cloud, and Azure provide robust analytics services, enabling organizations to handle large-scale data operations seamlessly.

Trend Highlight:

Hybrid and multi-cloud strategies are becoming popular as companies seek to avoid vendor lock-in and optimize costs.


9. Data Visualization Evolution

The ability to communicate insights effectively is as important as generating them. Modern data visualization tools now include interactive dashboards, storytelling features, and augmented reality (AR) capabilities. These advancements make it easier to convey complex data narratives to diverse audiences.

Popular Tools:

  • Power BI
  • Tableau
  • D3.js

10. Sustainability Analytics

As sustainability becomes a priority, analytics is being used to track and optimize environmental, social, and governance (ESG) efforts. From carbon footprint analysis to waste management optimization, data-driven approaches are crucial for achieving sustainability goals.

Industries Leading the Way:

  • Energy and utilities
  • Manufacturing
  • Transportation

Conclusion

Data analytics continues to evolve, driven by technological advancements, changing consumer demands, and regulatory pressures. By staying ahead of these trends, organizations can harness the full potential of their data, gaining a competitive edge in an increasingly data-centric world. Whether it’s adopting AI-powered tools, ensuring ethical data practices, or leveraging real-time insights, the future of data analytics promises to be as dynamic as the data itself.

8th Floor ZB Chambers
15 George Silundika Avenue,
Harare, Harare 263
Zimbabwe
Phone: 0719397464
Email: info@dataanalysis.co.zw

Exploring Excel’s LET Function: Simplifying Complex Formulas

Demystifying Data: The Power of Data Storytelling

How AI is Revolutionizing Weather Forecasting?

kampungbet

kampungbet

kampungbet

kampungbet

kampungbet

kampungbet

kampungbet

kampungbet

Exploring Excel’s LET Function: Simplifying Complex Formulas

Exploring Excel's LET Function: Simplifying Complex Formulas

Exploring Excel’s LET Function: Simplifying Complex Formulas

Microsoft Excel has always been a cornerstone for data analysis, financial modeling, and productivity solutions. Among its many powerful features, the introduction of the LET function has emerged as a game-changer for professionals dealing with complex formulas. Available in Excel 365 and Excel 2021, LET simplifies calculations, enhances performance, and improves formula readability, making it a must-learn tool for contemporary Excel users.

What is the LET Function?

The LET function allows you to assign names to calculation results and reuse them within a formula. Think of it as creating variables inside Excel formulas. This not only makes your formulas shorter and easier to understand but also improves their efficiency by calculating values once and reusing them multiple times.

The syntax of the LET function is:

=LET(name1, value1, [name2, value2], ..., calculation)
  • name1: The name for the first variable.
  • value1: The value or calculation assigned to the first variable.
  • calculation: The final result using the defined variables.

Why is LET a Big Deal?

  1. Improved Formula Readability: By assigning names to intermediate steps, LET transforms complex, nested formulas into straightforward expressions. This makes it easier to debug and share your work.
  2. Better Performance: LET calculates values once and reuses them, reducing computation time, especially in large datasets or complex calculations.
  3. Flexibility in Formula Creation: It bridges the gap between simple formulas and full-fledged VBA scripting, making advanced solutions accessible to more users.

Examples of the LET Function in Action

  1. Simplifying Repeated Calculations
    Let’s say you want to calculate the profit margin for sales data using the formula:

    =(Revenue - Cost) / Revenue  
    

    Instead of repeating (Revenue - Cost) multiple times, you can use LET:

    =LET(Profit, Revenue - Cost, Profit / Revenue)
    
  2. Calculating Dynamic Ranges
    Suppose you need the average of the first N numbers in a range. Using LET, you can define N as a variable:

    =LET(N, 5, AVERAGE(A1:INDEX(A:A, N)))
    

    Here, you can easily adjust the value of N without editing the entire formula.

  3. Enhanced Conditional Logic
    Combining LET with logical functions like IF and CHOOSE streamlines conditional formulas. For instance, categorizing sales into tiers:

    =LET(Sale, A1, 
         IF(Sale > 1000, "High", 
         IF(Sale > 500, "Medium", "Low")))
    
  4. Custom Weighted Averages
    If you’re working with weighted averages, LET can make the formula cleaner:

    =LET(TotalWeight, SUM(Weights), 
         WeightedAvg, SUM(Values * Weights) / TotalWeight, 
         WeightedAvg)
    

Best Practices for Using LET

  1. Choose Descriptive Variable Names: Use meaningful names to improve formula readability, e.g., DiscountedPrice instead of X.
  2. Test with Simple Examples: Start with straightforward use cases to understand how LET works before applying it to complex scenarios.
  3. Combine with New Excel Functions: LET pairs well with Dynamic Array functions like FILTER, SORT, and UNIQUE, enabling powerful and efficient workflows.
  4. Document Your Work: Include comments in your workbook to explain the purpose of variables in LET formulas for colleagues or future reference.

Real-World Applications of LET

  • Finance: Calculate tax, interest, or loan repayment schedules while keeping formulas compact.
  • Marketing: Create dynamic pricing models or ROI calculations based on variable scenarios.
  • Data Cleaning: Simplify transformations like text splitting, concatenation, or case adjustments.
  • Operations: Streamline inventory calculations or resource allocation formulas.

8th Floor ZB Chambers
15 George Silundika Avenue,
Harare, Harare 263
Zimbabwe
Phone: 0719397464

kampungbet

kampungbet

https://ijins.umsida.ac.id/data/

kampungbet

https://polreskedirikota.id/

kampungbet

kampungbet

kampungbet

kampungbet

kampungbet

kampungbet

kampungbet

kampungbet

Demystifying Data: The Power of Data Storytelling

Data storytelling

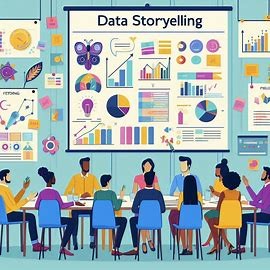
Demystifying Data: The Power of Data Storytelling

Introduction

Data analytics has evolved from a niche field to a cornerstone of decision-making across industries. While numbers and statistics are essential, the real magic lies in transforming raw data into compelling narratives. Data storytelling is the art of communicating complex insights in a way that resonates with your audience, whether they’re seasoned analysts or business leaders.

The Importance of Data Storytelling

  • Enhanced Decision Making: Stories make information more memorable and actionable, leading to better-informed decisions.
  • Improved Communication: Complex data can be simplified and communicated effectively, fostering collaboration.
  • Increased Engagement: By connecting with the audience on an emotional level, data storytelling drives impact.

Key Elements of Effective Data Storytelling

  1. Know Your Audience: Understand their background, interests, and goals to tailor your story accordingly.
  2. Identify a Compelling Narrative: Find the underlying story in your data. What’s the main message you want to convey?
  3. Choose the Right Visuals: Select charts, graphs, and images that complement your story and enhance understanding.
  4. Use Clear and Concise Language: Avoid jargon and technical terms that might confuse your audience.
  5. Practice and Refine: Storytelling is a skill that improves with practice. Seek feedback and iterate on your approach.

Real-World Examples of Data Storytelling

  • Business: A marketing team uses data to demonstrate the impact of a new campaign on customer acquisition and retention.
  • Healthcare: A researcher tells the story of how data-driven insights led to the development of a life-saving treatment.
  • Social Impact: A non-profit organization uses data to highlight the challenges faced by a community and advocate for change.

Tools and Techniques

  • Data Visualization: Tools like Tableau, Power BI, and Python libraries (Matplotlib, Seaborn) can create stunning visuals.
  • Narrative Building: Consider using storytelling frameworks like the Hero’s Journey or the Freytag Pyramid.
  • Interactive Storytelling: Platforms like Tableau and Looker allow for interactive exploration of data.

Conclusion

Data storytelling is a powerful tool that can transform how we perceive and use information. By mastering the art of weaving data into compelling narratives, you can influence decisions, inspire action, and drive positive change.

Would you like to explore a specific data storytelling technique or industry application in more detail?

8th Floor ZB Chambers
15 George Silundika Avenue,
Harare, Harare 263
Zimbabwe
Phone: 0719397464

kampungbet

kampungbet

https://ijins.umsida.ac.id/data/

kampungbet

https://polreskedirikota.id/

kampungbet

kampungbet

kampungbet

kampungbet

kampungbet

kampungbet

kampungbet

kampungbet

Connecting Excel to the Cloud

Connecting Excel to the Cloud: Unleash the Power of Your Data

Microsoft Excel remains a cornerstone for data analysis and manipulation. But in today’s world, keeping your spreadsheets isolated on a local machine can limit your potential. Connecting Excel to the cloud opens a world of possibilities, allowing you to collaborate, access data from anywhere, and leverage powerful cloud-based tools.

Why Connect Excel to the Cloud?

Here are some compelling reasons to take your spreadsheets to the cloud:

  • Enhanced Collaboration: Cloud storage platforms, like OneDrive or Google Drive, enable real-time collaboration. Team members can access and edit the same spreadsheet simultaneously, eliminating version control issues and streamlining teamwork.
  • Accessibility Anywhere, Anytime: Access your spreadsheets from any device with an internet connection. No more scrambling to find the latest version on your local machine – your data is always available on the cloud.
  • Integration with Cloud Services: Unlock the potential of powerful cloud-based tools like Power BI (Microsoft) or Google Data Studio. These platforms seamlessly integrate with Excel, allowing you to analyze large datasets, create interactive visualizations, and generate insightful reports.
  • Improved Version Control and Backup: Cloud storage automatically saves changes, providing a secure backup solution and eliminating the risk of data loss from local hardware failures.
  • Scalability and Flexibility: Cloud platforms offer the ability to scale your storage capacity as your data needs grow. No need to worry about exceeding local storage limitations.

How to Connect Excel to the Cloud:

There are two main approaches to connecting Excel to the cloud:

  • Cloud Storage: Save your Excel files on a cloud storage platform like OneDrive, Google Drive, or Dropbox. This allows you and your team to access the files from anywhere with an internet connection.
  • Cloud Data Services: Connect Excel to cloud data services like Power BI or Google Data Studio. This enables you to import data directly from the cloud, analyze it within Excel, and build interactive dashboards and reports.

Connecting to cloud storage platforms is a straightforward process. Simply save your Excel files within the chosen cloud folder on your device. The platform automatically synchronizes the files, making them accessible from any device connected to the internet.

Connecting to cloud data services involves a few additional steps. These services typically provide specific instructions and add-ins for Excel that facilitate the connection and data import process.

Embrace the Advantages of a Cloud-Connected Excel

By embracing cloud connectivity, you can unlock new levels of efficiency and collaboration within Excel. Work seamlessly with your team, access your data anywhere, and leverage powerful cloud tools to take your data analysis to the next level. So, ditch the limitations of local storage and connect your Excel to the cloud – the future of data analysis awaits!

Have you explored connecting Excel to the cloud? Share your experiences and tips in the comments below!

8th Floor ZB Chambers
15 George Silundika Avenue,
Harare, Harare 263
Zimbabwe
Phone: 0719397464

Unlocking the power of checkboxes in Excel

Uncovering Patterns: Exploratory Data Analysis in Action

10 Excel Functions you must know

Microsoft Power BI Training Course

kampungbet

kampungbet

https://ijins.umsida.ac.id/data/

kampungbet

https://polreskedirikota.id/

kampungbet

kampungbet

kampungbet

kampungbet

kampungbet

kampungbet

kampungbet

kampungbet

Unlocking the power of checkboxes in Excel

checkboxes

Unlocking the Power of Checkboxes in MS Excel: A Game-Changer for Data Entry and Interactivity

For years, Excel users have relied on cumbersome methods for data selection and interaction. But with the introduction of checkboxes, a new era of user-friendly data management has arrived. Whether you’re a seasoned Excel pro or just starting your spreadsheet journey, understanding the power of checkboxes can transform your workflow.

What are Checkboxes in Excel?

Checkboxes are interactive elements that can be inserted into your spreadsheet cells. Clicking a checkbox allows you to select or deselect an option, visually representing the underlying data (TRUE or FALSE). This makes data entry and manipulation much easier and more intuitive for users.

Benefits of Using Checkboxes:

  • Simplified Data Entry: Gone are the days of manually entering “Yes” or “No” or using cumbersome drop-down menus. Checkboxes offer a quick and clear way to select options, reducing errors and speeding up data input.
  • Enhanced User Experience: Checkboxes add a visual element to your spreadsheet, making it interactive and user-friendly. Users can easily identify and select options, improving the overall experience.
  • Improved Data Filtering and Sorting: Leveraging checkboxes, you can filter and sort your data based on selected options. This enables you to quickly focus on specific subsets of data, enhancing analysis and reporting capabilities.
  • Dynamic Dashboards: Integrating checkboxes into your dashboards allows users to interact with the data visually. By checking or unchecking boxes, users can filter the displayed information in real-time, fostering self-service data exploration.

How to Use Checkboxes in Excel:

Adding checkboxes in Excel is a simple process:

  1. Select the cells where you want to insert the checkboxes.
  2. Go to the Developer tab (if it’s not visible, you can enable it by going to File > Options > Customize Ribbon and checking the box next to Developer).
  3. Click the Insert button in the Controls section of the Developer tab.
  4. Choose Checkbox from the list of options.
  5. Once inserted, customize the checkbox properties by right-clicking it and selecting Format Control. Here you can adjust the appearance and link the checkbox to a specific cell containing the TRUE/FALSE value.

Creative Applications of Checkboxes:

Beyond basic data entry, checkboxes can be used for various creative applications:

  • Create To-Do Lists: Use checkboxes to mark completed tasks, providing a visual progress tracker.
  • Track Inventory Status: Implement checkboxes to indicate available or unavailable items.
  • Build Interactive Surveys: Design surveys with checkbox options for user selection.
  • Filter Data Based on Multiple Criteria: Combine checkboxes with other filtering methods to create dynamic and complex data exploration options.

Unlocking the potential of checkboxes in MS Excel offers significant benefits for both data entry and data interaction. By incorporating these interactive elements into your spreadsheets, you can improve efficiency, enhance user experience, and build more dynamic and informative reports.

Do you have any creative ways you’ve used checkboxes in Excel? Share your tips and experiences in the comments below!

8th Floor ZB Chambers
15 George Silundika Avenue,
Harare, Harare 263
Zimbabwe
Phone: 0719397464

Marketing Analytics: From Buzzword to Business Booster

Why learn Excel?

10 Excel Functions you must know

7 tools every Excel user must know

If you have any quesries you are free to contact us.

Please enable JavaScript in your browser to complete this form.
Name

kampungbet

kampungbet

https://ijins.umsida.ac.id/data/

kampungbet

https://polreskedirikota.id/

kampungbet

kampungbet

kampungbet

kampungbet

kampungbet

kampungbet

kampungbet

kampungbet

How AI is Revolutionizing Weather Forecasting?

How AI is Revolutionizing Weather Forecasting?

How AI is Revolutionizing Weather Forecasting?

For centuries, humans have looked to the skies for clues about the weather. From ancient proverbs to high-powered satellites, we’ve constantly strived to improve our ability to predict rain or shine. But what if the future of weather forecasting lies not just in data, but in artificial intelligence (AI)?

Traditionally, weather prediction relies on complex mathematical models that crunch vast amounts of atmospheric data. While effective, these models can struggle with the inherent chaos of weather systems. This is where AI comes in.

Machine learning algorithms are being trained on massive datasets of past weather events. By identifying patterns and relationships within this data, AI can “learn” to predict future weather with incredible accuracy. This allows for:

  • Hyperlocal forecasting: AI can account for microclimates and other localized factors, providing hyper-accurate forecasts for your specific neighborhood.
  • Improved severe weather prediction: By recognizing subtle shifts in atmospheric patterns, AI can provide earlier warnings of storms, floods, and other extreme weather events.
  • Better decision-making: From farmers planning harvests to airlines optimizing flight routes, AI-powered weather forecasts can empower businesses and individuals to make smarter decisions.

However, challenges remain. Training AI models requires immense computing power and high-quality data. Additionally, ensuring the ethical use of AI in weather forecasting, such as preventing manipulation or bias in predictions, is crucial.

Despite these challenges, the potential of AI in weather forecasting is undeniable. As AI and data analysis techniques continue to evolve, we can expect even more precise and actionable weather forecasts. This not only benefits our daily lives but also holds the potential to revolutionize industries that rely heavily on accurate weather predictions, from agriculture to disaster preparedness.

What do you think? How can AI help us better understand and predict the weather? Share your thoughts in the comments below!

Unlocking the power of checkboxes in Excel

Uncovering Patterns: Exploratory Data Analysis in Action

Essential skills for data analysts

8th Floor ZB Chambers
15 George Silundika Avenue,
Harare, Harare 263
Zimbabwe
Phone: 0719397464

kampungbet

kampungbet

https://ijins.umsida.ac.id/data/

kampungbet

https://polreskedirikota.id/

kampungbet

kampungbet

kampungbet

kampungbet

kampungbet

kampungbet

kampungbet

kampungbet