How AI Is Revolutionising Customer Experience in Business

How Generative AI Is Revolutionising Customer Experience in Business

How AI Is Revolutionising Customer Experience in Business

In today’s rapidly digitizing world, businesses are constantly looking for ways to elevate customer experience (CX), not just to meet expectations, but to anticipate and exceed them. Among the most powerful tools reshaping this space is Generative AI, a category of artificial intelligence that creates content, conversation, design, and decision support in real time.

From customer service to product design, generative AI is not just enhancing efficiency, it’s redefining how businesses engage with people.

What is Generative AI?

Generative AI refers to systems capable of creating original outputs , text, images, audio, video, and even code, based on patterns learned from vast datasets. Tools like ChatGPT, DALL·E, and Google’s Gemini are examples of generative AI platforms that can simulate human-like creativity and reasoning at scale.

Why Customer Experience Matters More Than Ever

In an era of commoditized products and abundant choices, experience is what differentiates a brand. Research shows that companies that lead in customer experience outperform their competitors in terms of revenue growth and customer retention. The key challenge? Delivering consistent, personalized, and high-quality service across multiple channels.

How Generative AI is Transforming CX

1. Hyper-Personalized Interactions

Generative AI can instantly generate customer-specific responses based on purchase history, browsing behavior, or real-time context. Imagine a chatbot that remembers a customer’s last inquiry, offers tailored product recommendations, and adjusts its tone to match the customer’s communication style, all autonomously.

2. 24/7 Intelligent Customer Support

Traditional chatbots were rule-based and often frustrating. Now, AI-powered virtual agents can handle complex queries, escalate issues when necessary, and even simulate empathy, providing a more humanized support experience without the wait times.

3. Smarter Product Descriptions and Content

Generative AI can dynamically generate product descriptions, marketing emails, and FAQs that match a user’s preferences. This allows e-commerce businesses, for example, to speak directly to different personas without manually rewriting content.

4. Voice and Visual AI Interfaces

AI voice assistants are becoming more natural and responsive. Meanwhile, image-based AI can help customers “try on” clothes virtually, scan real-world objects for information, or design custom furniture with a prompt. These features merge AI creativity with real customer value.

5. Real-Time Feedback and Sentiment Analysis

Generative AI can sift through customer reviews, social media mentions, and support tickets to identify pain points and recommend service improvements. It doesn’t just collect data, it interprets and translates it into actionable insights.

Challenges and Ethical Considerations

Despite its promise, the rise of generative AI brings challenges:

  • Bias and hallucinations: AI can generate misleading or biased content if not trained responsibly.
  • Privacy concerns: Handling customer data must comply with global data protection standards (e.g., GDPR, POPIA).
  • Human touch: While AI enhances scale, human oversight is essential in emotionally sensitive or high-stakes interactions.

Businesses must blend automation with empathy, and use AI to enhance human capabilities, not replace them.

Looking Ahead: Augmented CX Teams

The future is likely to see hybrid teams where humans and AI collaborate seamlessly. Generative AI will handle repetitive and predictive tasks, freeing up employees to focus on creativity, strategic thinking, and building relationships.

Companies that invest in AI literacy, ethical frameworks, and customer-centric design today will be the CX leaders of tomorrow.

Conclusion

Generative AI is not just a trend, it’s a foundational shift in how businesses can deliver value. Those who embrace it thoughtfully and strategically will redefine what’s possible in customer experience.

Are you ready to unlock the full potential of AI in your business?

Need help integrating AI into your customer experience strategy? Contact us for a consultation.

Please enable JavaScript in your browser to complete this form.
Name

How Generative AI is Transforming Business in 2025

Artificial Intelligence (AI) Training Courses

How AI is Revolutionizing Weather Forecasting?

Data security in collaborative data analytics

8th Floor ZB Chambers
15 George Silundika Avenue,
Harare, Harare 263
Zimbabwe
Phone: 0719397464
Email: info@dataanalysis.co.zw

kampungbet

kampungbet

kampungbet

How Generative AI is Transforming Business in 2025

How Generative AI is Transforming Business in 2025

How Generative AI is Transforming Business in 2025

In 2025, artificial intelligence (AI) is no longer a futuristic concept, it’s a present-day powerhouse, reshaping how businesses operate, compete, and grow. At the heart of this transformation is generative AI, a technology that enables machines to create content, code, designs, forecasts, and even strategies, with unprecedented speed and scale.

What Is Generative AI?

Generative AI refers to AI models that can generate new content based on training data. Tools like ChatGPT, DALL·E, Claude, and Google’s Gemini are leading examples. These models use large datasets and advanced algorithms to produce human-like text, images, audio, video, and more.

But beyond creative tasks, generative AI is rapidly becoming a strategic asset across nearly every sector of the economy.

1. Content Creation and Marketing

In content-driven industries, generative AI has drastically reduced the time and cost of producing marketing assets. Businesses now use AI to:

  • Write blogs, product descriptions, and ad copy
  • Create social media content and schedules
  • Generate customer personas and campaign ideas
  • Translate and localize content in multiple languages

The result? Marketing teams are shifting from content creation to content curation and strategy.

2. Customer Service and Sales

AI chatbots and virtual assistants are handling millions of customer interactions with increased empathy and contextual understanding. Sales teams are leveraging AI to:

  • Write personalized email outreach
  • Generate follow-up messages
  • Analyze leads and prioritize prospects
  • Simulate customer objections and responses

This enables real-time engagement and improved customer satisfaction without increasing human labor costs.

3. Product Design and Development

Generative AI is revolutionizing how companies innovate:

  • Designers use AI to generate product mockups and prototypes
  • Engineers co-create code using AI coding assistants
  • Auto manufacturers use AI to simulate designs and performance
  • Pharmaceutical companies use AI to generate molecular structures for drug discovery

It’s not just faster—it’s smarter, often surfacing options humans wouldn’t have considered.

4. Data Analysis and Decision-Making

AI is no longer just a tool for analysis—it’s a partner in thinking. Executives use AI to:

  • Generate dashboards and summaries from complex data
  • Create business forecasts based on historical and real-time inputs
  • Simulate “what-if” scenarios for strategic planning

This democratizes data insights, empowering non-technical users to make data-driven decisions.

5. Risk Management and Compliance

In finance, insurance, and legal industries, AI is improving regulatory compliance and risk detection. AI models can:

  • Review and draft contracts
  • Identify patterns of fraud
  • Flag unusual financial transactions
  • Generate audit-ready documentation

AI doesn’t just protect the business—it makes it more agile in the face of risk.

Challenges to Consider

As with any transformative technology, generative AI poses risks:

  • Bias and misinformation: AI can reflect the biases in its training data.
  • Job displacement: While AI augments many roles, some repetitive jobs are at risk.
  • Data privacy: Businesses must carefully manage how they use customer data in training models.
  • Dependence: Overreliance on AI without human oversight can be dangerous.

Smart businesses are addressing these through AI governance policies and human-in-the-loop strategies

Looking Ahead

The future of business belongs to those who can blend human creativity with AI-powered productivity. Generative AI is not replacing professionals, it’s empowering them. In 2025, forward-thinking companies are not asking “Should we use AI?” but rather “How can we best use AI responsibly and competitively?”

Whether you’re a startup founder, marketing director, operations manager, or CEO, embracing AI is no longer optional. It’s your edge.

Want to learn more about integrating AI into your business strategy? Let’s connect.
#AIinBusiness #GenerativeAI #FutureofWork #Innovation

How AI is Revolutionizing Weather Forecasting?

10 principles of data-driven companies

AI for Business Professionals Training Course

Artificial Intelligence (AI) Training Courses

8th Floor ZB Chambers
15 George Silundika Avenue,
Harare, Harare 263
Zimbabwe
Phone: 0719397464
Email: info@dataanalysis.co.zw

kampungbet

kampungbet

kampungbet

Exploring Excel’s LET Function: Simplifying Complex Formulas

Exploring Excel's LET Function: Simplifying Complex Formulas

Exploring Excel’s LET Function: Simplifying Complex Formulas

Microsoft Excel has always been a cornerstone for data analysis, financial modeling, and productivity solutions. Among its many powerful features, the introduction of the LET function has emerged as a game-changer for professionals dealing with complex formulas. Available in Excel 365 and Excel 2021, LET simplifies calculations, enhances performance, and improves formula readability, making it a must-learn tool for contemporary Excel users.

What is the LET Function?

The LET function allows you to assign names to calculation results and reuse them within a formula. Think of it as creating variables inside Excel formulas. This not only makes your formulas shorter and easier to understand but also improves their efficiency by calculating values once and reusing them multiple times.

The syntax of the LET function is:

=LET(name1, value1, [name2, value2], ..., calculation)
  • name1: The name for the first variable.
  • value1: The value or calculation assigned to the first variable.
  • calculation: The final result using the defined variables.

Why is LET a Big Deal?

  1. Improved Formula Readability: By assigning names to intermediate steps, LET transforms complex, nested formulas into straightforward expressions. This makes it easier to debug and share your work.
  2. Better Performance: LET calculates values once and reuses them, reducing computation time, especially in large datasets or complex calculations.
  3. Flexibility in Formula Creation: It bridges the gap between simple formulas and full-fledged VBA scripting, making advanced solutions accessible to more users.

Examples of the LET Function in Action

  1. Simplifying Repeated Calculations
    Let’s say you want to calculate the profit margin for sales data using the formula:

    =(Revenue - Cost) / Revenue  
    

    Instead of repeating (Revenue - Cost) multiple times, you can use LET:

    =LET(Profit, Revenue - Cost, Profit / Revenue)
    
  2. Calculating Dynamic Ranges
    Suppose you need the average of the first N numbers in a range. Using LET, you can define N as a variable:

    =LET(N, 5, AVERAGE(A1:INDEX(A:A, N)))
    

    Here, you can easily adjust the value of N without editing the entire formula.

  3. Enhanced Conditional Logic
    Combining LET with logical functions like IF and CHOOSE streamlines conditional formulas. For instance, categorizing sales into tiers:

    =LET(Sale, A1, 
         IF(Sale > 1000, "High", 
         IF(Sale > 500, "Medium", "Low")))
    
  4. Custom Weighted Averages
    If you’re working with weighted averages, LET can make the formula cleaner:

    =LET(TotalWeight, SUM(Weights), 
         WeightedAvg, SUM(Values * Weights) / TotalWeight, 
         WeightedAvg)
    

Best Practices for Using LET

  1. Choose Descriptive Variable Names: Use meaningful names to improve formula readability, e.g., DiscountedPrice instead of X.
  2. Test with Simple Examples: Start with straightforward use cases to understand how LET works before applying it to complex scenarios.
  3. Combine with New Excel Functions: LET pairs well with Dynamic Array functions like FILTER, SORT, and UNIQUE, enabling powerful and efficient workflows.
  4. Document Your Work: Include comments in your workbook to explain the purpose of variables in LET formulas for colleagues or future reference.

Real-World Applications of LET

  • Finance: Calculate tax, interest, or loan repayment schedules while keeping formulas compact.
  • Marketing: Create dynamic pricing models or ROI calculations based on variable scenarios.
  • Data Cleaning: Simplify transformations like text splitting, concatenation, or case adjustments.
  • Operations: Streamline inventory calculations or resource allocation formulas.

8th Floor ZB Chambers
15 George Silundika Avenue,
Harare, Harare 263
Zimbabwe
Phone: 0719397464

kampungbet

kampungbet

https://ijins.umsida.ac.id/data/

kampungbet

https://polreskedirikota.id/

kampungbet

kampungbet

kampungbet

kampungbet

kampungbet

kampungbet

kampungbet

kampungbet

Demystifying Data: The Power of Data Storytelling

Data storytelling

Demystifying Data: The Power of Data Storytelling

Introduction

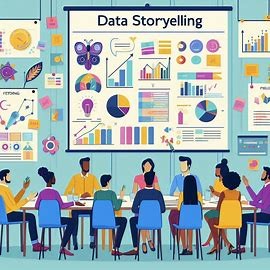
Data analytics has evolved from a niche field to a cornerstone of decision-making across industries. While numbers and statistics are essential, the real magic lies in transforming raw data into compelling narratives. Data storytelling is the art of communicating complex insights in a way that resonates with your audience, whether they’re seasoned analysts or business leaders.

The Importance of Data Storytelling

  • Enhanced Decision Making: Stories make information more memorable and actionable, leading to better-informed decisions.
  • Improved Communication: Complex data can be simplified and communicated effectively, fostering collaboration.
  • Increased Engagement: By connecting with the audience on an emotional level, data storytelling drives impact.

Key Elements of Effective Data Storytelling

  1. Know Your Audience: Understand their background, interests, and goals to tailor your story accordingly.
  2. Identify a Compelling Narrative: Find the underlying story in your data. What’s the main message you want to convey?
  3. Choose the Right Visuals: Select charts, graphs, and images that complement your story and enhance understanding.
  4. Use Clear and Concise Language: Avoid jargon and technical terms that might confuse your audience.
  5. Practice and Refine: Storytelling is a skill that improves with practice. Seek feedback and iterate on your approach.

Real-World Examples of Data Storytelling

  • Business: A marketing team uses data to demonstrate the impact of a new campaign on customer acquisition and retention.
  • Healthcare: A researcher tells the story of how data-driven insights led to the development of a life-saving treatment.
  • Social Impact: A non-profit organization uses data to highlight the challenges faced by a community and advocate for change.

Tools and Techniques

  • Data Visualization: Tools like Tableau, Power BI, and Python libraries (Matplotlib, Seaborn) can create stunning visuals.
  • Narrative Building: Consider using storytelling frameworks like the Hero’s Journey or the Freytag Pyramid.
  • Interactive Storytelling: Platforms like Tableau and Looker allow for interactive exploration of data.

Conclusion

Data storytelling is a powerful tool that can transform how we perceive and use information. By mastering the art of weaving data into compelling narratives, you can influence decisions, inspire action, and drive positive change.

Would you like to explore a specific data storytelling technique or industry application in more detail?

8th Floor ZB Chambers
15 George Silundika Avenue,
Harare, Harare 263
Zimbabwe
Phone: 0719397464

kampungbet

kampungbet

https://ijins.umsida.ac.id/data/

kampungbet

https://polreskedirikota.id/

kampungbet

kampungbet

kampungbet

kampungbet

kampungbet

kampungbet

kampungbet

kampungbet

Uncovering Patterns: Exploratory Data Analysis in Action

Uncovering patterns : Exploratory data analytics

Uncovering Patterns: Exploratory Data Analysis in Action

In the world of data science, exploratory data analysis (EDA) is a critical first step in any data analysis project. EDA is the process of inspecting, cleaning, and exploring data with the goal of discovering patterns and trends. By understanding the data, analysts can better ask questions, build models, and make predictions.

There are many different techniques that can be used for EDA, but some of the most common include:

Visualization: Creating charts and graphs to visualize the data can help to identify patterns and trends that may not be obvious from looking at the raw data.

Statistical analysis: Using statistical tests to measure the relationships between different variables can help to identify significant patterns.

Data mining: Using data mining algorithms to identify patterns and trends in large datasets can be helpful when the data is too complex to analyse manually.

Uncovering patterns : Exploratory data analytics in action

EDA is an iterative process, meaning that it is often necessary to repeat the steps of inspection, cleaning, and exploration as new insights are gained. By continually exploring the data, analysts can uncover hidden patterns and trends that can lead to valuable insights.

Here are some examples of how EDA has been used to uncover patterns in data:

  • A marketing analyst used EDA to identify that a particular product was being purchased more often by customers who lived in urban areas. This information could be used to target marketing campaigns more effectively.
  • A financial analyst used EDA to identify that the stock price of a particular company was correlated with the price of oil. This information could be used to make predictions about the future performance of the stock.
  • A healthcare researcher used EDA to identify that patients who were prescribed a particular medication were more likely to experience certain side effects. This information could be used to improve the safety of the medication.

These are just a few examples of how EDA can be used to uncover patterns in data. By understanding the data, analysts can make better decisions and improve the outcomes of their projects.

If you are interested in learning more about EDA, there are many resources available online and in libraries. There are also many data science courses that offer instruction on EDA. With a little effort, you can learn how to use EDA to uncover patterns in your own data. At Data Analytics Training and Advisory Services we train you to master the tools that you require to perform EDA.

Contact us to find out more

Microsoft Excel certification exam MO-210

Microsoft Excel Training Courses

Data Analyst Training Course Programme

Financial Modelling Using Excel Training Course

8th Floor ZB Chambers
15 George Silundika Avenue,
Harare, Harare 263
Zimbabwe
Phone: 0719397464

https://polreskedirikota.id/

kampungbet

kampungbet

Data Science vs. Data Analytics: What’s the Difference?

Data Science vs. Data Analytics: What's the Difference?

Data Science vs. Data Analytics: What’s the Difference?

Data science and data analytics are two of the most in-demand fields in today’s job market. Both disciplines involve working with data, but they have different goals and use different techniques.

Data science is a broad field that encompasses the collection, analysis, interpretation, and visualization of data. Data scientists use a variety of tools and techniques to extract insights from data, including machine learning, statistical analysis, and natural language processing. Data scientists are often involved in developing new products and services, improving business processes, and making strategic decisions.

Data analytics is a more focused field that focuses on the analysis of data to identify trends, patterns, and relationships. Data analysts use a variety of tools and techniques to clean, transform, and analyze data, and they often use visualization tools to communicate their findings to stakeholders. Data analysts are often involved in solving business problems, making recommendations, and improving decision-making.

Here is a table that summarizes the key differences between data science and data analytics:

Data Science Data Analytics
Broader field More focused field
Uses a variety of tools and techniques Uses a more limited set of tools and techniques
Focuses on extracting insights from data Focuses on identifying trends, patterns, and relationships in data
Often involved in developing new products and services, improving business processes, and making strategic decisions Often involved in solving business problems, making recommendations, and improving decision-making

It is important to note that the terms “data science” and “data analytics” are often used interchangeably. This is because the two fields are closely related and there is a lot of overlap between them. However, it is important to understand the distinctions between the two fields in order to make informed career choices and to communicate effectively with data scientists and data analysts.

The Future of Data Science and Data Analytics

The demand for data scientists and data analysts is expected to grow significantly in the coming years. This is due to the increasing amount of data being generated by businesses and individuals, as well as the growing need for businesses to use data to make better decisions.

If you are interested in a career in data science or data analytics, there are a few things you can do to prepare. First, you should develop strong skills in mathematics, statistics, and programming. You should also be familiar with a variety of data analysis tools and techniques. Additionally, you should be able to communicate effectively with both technical and non-technical audiences.

With the right skills and training, you can have a successful career in data science or data analytics. These are exciting fields that are at the forefront of innovation, and they offer the opportunity to make a real impact on the world.

Data Analytics Training and Advisory Services offers you the the opportunity to master the skills required to be a successful data analyst and get internationally recognised certification.

Contact us to get started with DATA ANALYTICS TRAINING

Microsoft Excel certification exam MO-210

Essential skills for data analysts

7 tools every Excel user must know

8th Floor ZB Chambers
15 George Silundika Avenue,
Harare, Harare 263
Zimbabwe
Phone: 0719397464
Email: info@dataanalysis.co.zw

https://polreskedirikota.id/

kampungbet

Essential skills for data analysts

Essential skills for data analysts

Essential skills for data analysts

Essential skills for data analysts are discussed here to help you with your journey to become a data analyst. Whichever method you choose to study the complete breadth of data analytics skills, there is a foundational set of knowledge you must possess. Data analysts must be skilled in a specific set of abilities because they work with a lot of data every day.
Technical abilities that a data analyst should possess include:

Structured Query Language (SQL)

SQL is a database language used for handling large datasets that can’t be handled in Excel. It’s ideal for managing and storing data, and relating multiple databases, among other things.

Data Visualization

Data visualization refers to the skill of presenting the findings of data in the form of graphics and illustrations.

Data Cleaning

Data cleaning is one of the most crucial steps while compiling machine learning models. A dataset that’s thoroughly cleaned and organized can even beat fancy algorithms.

Python

Python is a high-level programming language that offers a plethora of specialized libraries, all are related to artificial intelligence.

Machine Learning

There are numerous new AI and predictive analytics applications being developed in the data science community. For data analysts, machine learning expertise has essentially become a need.

Our blog is full with useful material if you still want to learn more about the topic of data analytics before taking any further steps. Learn everything you need to know before deciding if this is the correct field for you. We’ve already done the hard work for you.

Here are some more articles you can read:

Jobs where Excel skills will pay you handsomely

7 tools every Excel user must know

10 Excel Functions you must know

10 principles of data-driven companies

Microsoft Excel Training Courses

This blog post was written by Brian Johnknox Muyambo, Principal Consultant at Data Analytics Training and Advisory Services.

8th Floor ZB Chambers
15 George Silundika Avenue,
Harare, Harare 263
Zimbabwe
Phone: 0719397464
Email: info@dataanalysis.co.zw


kampungbet

7 tools every Excel user must know

business analytics using Excel

7 tools every Excel user must know

7 tools every Excel user must know were selected and presented by experts to help you get more out of excel.  7 tools which are set to improve your productivity and make you love excel more and more.

1. Slicers

Being able to quickly drill down into data is critical when analyzing. Instead of applying filters manually, add slicers to the data by navigating to the Insert tab > Slicers > select what you want to filter the data by and hit OK. Now just click any button to filter!

2. Power Query

Importing data into Excel never is as easy as it seems. Luckily, Power Query is here to fix that. Power Query imports data from various sources into Excel. So instead of copying data from the web, go to Data > From Web > enter URL > select the table and hit load.

3. Data types

Say goodbye to google searching and hello to data types. Data types pull in real-time data directly into your workbook. To create data types, select the data > Data tab > Select the data category. Now, you can select the data attributes you want to pull into Excel.

4. Named Ranges

Naming data will not only make your life easier when writing formulas but also make your formulas easier to understand. To name data, select the data > press CTRL SHIFT F3 > check where the headers are and press OK. Now you can reference the data by its name!

5. Custom Lists

If you enter recurring lists repeatedly, this one’s for you. You can create a custom list that Excel will recognize and autofill for you. Go to File > Options > Advanced > Edit Custom Lists > Import List > OK. Now, enter any value and fill with the fill handle.

7. Sparklines

Stay on top of (Excel) trends with sparklines. A sparkline is a mini line chart that visually represents data trends. To insert them, press ALT N SL > select the data range you want to visualize and hit okay. Lastly, fill the sparklines down using the fill handle.

10 must know Excel shortcuts

Why you should use data analysis in business

Data Analytics Training Courses

10 Excel shortcuts you must know

Microsoft Excel Training Courses

10 Excel shortcuts you must know

1. CTRL E

CTRL E makes complicated tasks easier than ever, thanks to Flash Fill. Flash Fill automatically fills data down a column based on detected patterns. Just enter how you want the data to appear, hit CTRL E, and Excel will fill the pattern down the column in a flash.

2. ALT =

Let Excel do the math for you with this shortcut! ALT = detects data in adjacent cells and automatically sums it using the SUM function. Just select an empty cell adjacent to the data that needs to be added and press ALT =.

3. ALT H O I

If you are unable to see your data, ALT H O I is here to help! Press ALT H O I to automatically adjust the column widths to fit the size of your data.

4. ALT ↓

If you are entering repetitive data in Excel, ALT ↓ is a must-know shortcut. The Alt ↓ shortcut displays a dropdown list of all values previously entered in the column. Now, you can simply select any value, which will automatically be entered into the active cell!

5. CTRL `

When cranking out formulas in Excel, checking each one individually in the formula bar can be tedious. Instead, try the CTRL ` shortcut! CTRL ` toggles between displaying the cells’ formulas and values in the active worksheet.

6. CTRL ENTER

Dragging formulas down columns and then again across rows can be a drag. Say goodbye to the fill handle and hello to CTRL ENTER! CTRL ENTER fills the active cell’s contents into selected cells. Note: The active cell has to be in editing mode for this to work.

7. CTRL T

Start getting into the routine of using Tables with CTRL T. CTRL T converts data to an Excel Table. Tables are a powerful tool that clean up formatting, auto-fill formulas down columns, automatically expand and update linked charts when new rows are added, and more!

8. ALT F1

If you are spending too much time creating charts to visualize data, meet ALT F1. These two magical keys automatically create a bar chart using the selected data and insert it right into the active worksheet!

9. ALT W VG

Are you team gridlines or no gridlines? If you’re team no gridlines, this ones for you. The ALT W VG shortcut removes all gridlines from the active worksheet.

10. CTRL SHIFT L

Last but not least, CTRL SHIFT L. CTRL SHIFT L makes analyzing large data sets a little easier by adding the Sort & Filter toggles to the top row of the data set, so you can quickly sort and filter data.

Like these shortcuts and want more? You can learn much more about Excel shortcuts and tricks by attending our training courses.

Microsoft Excel Data Analysis Training Course

Advanced Microsoft Excel Training Course

Business Analytics with Excel Training Course

Financial Modelling Using Excel Training Course

Advanced Statistical Analysis Using SPSS Training Course

8th Floor ZB Chambers
15 George Silundika Avenue,
Harare, Harare 263
Zimbabwe
Phone: 0719397464

Why you should learn VBA

VBA

Why you should learn VBA

Why you should learn VBA explained in simple terms

VBA stands for Visual Basic for Applications (Microsoft). I’m aware that this seems dull and technical.
But the main focus of VBA is automating Excel’s operations. I’ll clarify what it implies. For instance, you may use VBA to configure Excel to automatically copy and paste any desired content when you cut and paste. That’s fantastic. But the length of time it takes is truly fantastic.
VBA does not require “human” time to do tasks. Computer time—which is only a few seconds—is required. So if you typically spend an hour each month copying and pasting updates to a report…
You can do it quickly if you know how to use VBA. And it goes beyond just copying and pasting. You may ask Excel to perform intricate research, generate a Profit and Loss Statement, or even construct a whole PowerPoint slide show!
Automation is the process of using VBA to automate Excel
The industrial revolution was caused by automation… because technological advancements allowed for far higher production from firms.
Anyway, after you’ve saved time, you’re free to use it for worthwhile endeavours. Do a two-hour work lunch, browse your Instagram feed, or perhaps do what I did and take additional actions that can advance your career.
One of VBA’s main advantages is that. Making time for yourself, not just preserving it.
You will also enjoy reading and learn more from these other articles:

8th Floor ZB Chambers
15 George Silundika Avenue,
Harare, Harare 263
Zimbabwe
Phone: 0719397464