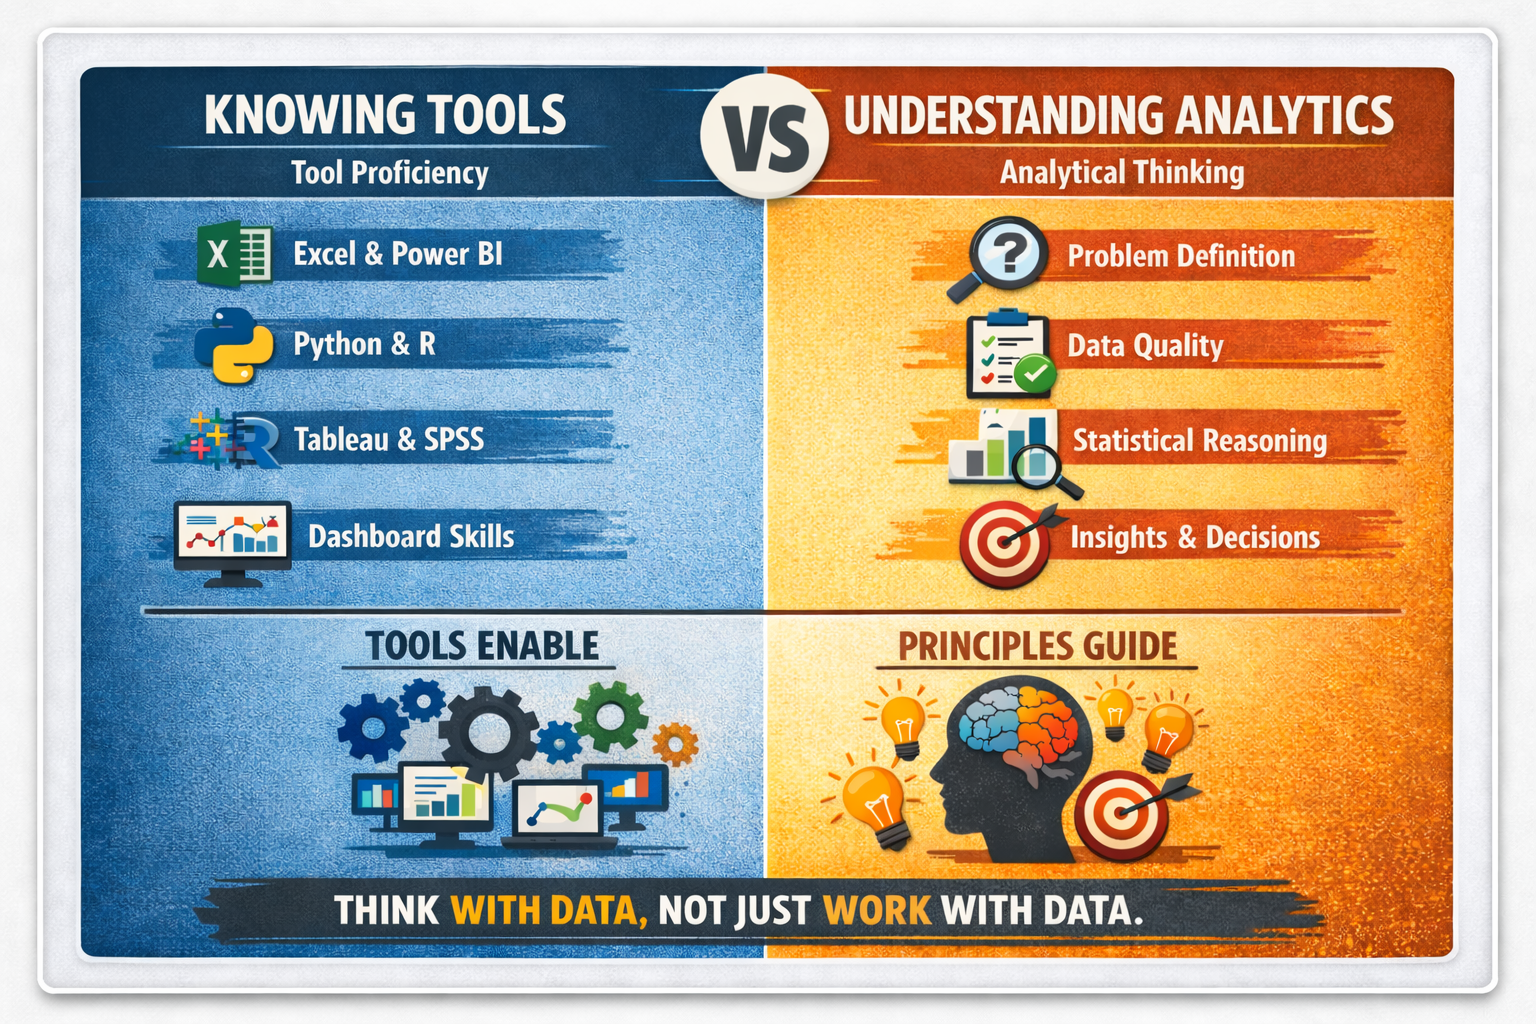
In today’s data-driven world, it has become common to equate data analytics with the ability to use tools such as Excel, Power BI, Python, R, SPSS, or Tableau. Job descriptions, training adverts, and even academic programmes often emphasize tool proficiency as the defining feature of a data analyst. While tools are undeniably important, this mindset reflects a fundamental misunderstanding of what data analytics truly is.
Data analytics is not about tools first. It is about thinking.
The Tool-Centric Misconception
Many people believe that once they can build dashboards, write formulas, or run scripts, they are “doing data analytics.” This is similar to assuming that knowing how to operate a calculator makes one a mathematician, or that owning a stethoscope makes one a doctor. Tools enable work, but they do not define expertise.
A person may be highly skilled in Excel or Power BI and still struggle to answer basic questions such as:
• What problem are we trying to solve?
• What data is relevant and what data is noise?
• What assumptions are embedded in this analysis?
• What decision should be taken based on these results?
Without the ability to answer these questions, analytics becomes mechanical rather than meaningful.
Data Analytics as a Way of Thinking
At its core, data analytics is a disciplined way of reasoning with data to support decisions. It involves understanding how data is generated, how it reflects real-world processes, and how it can be transformed into insight.
Key principles underpinning data analytics include problem formulation, hypothesis thinking, data quality assessment, analytical reasoning, interpretation, and communication. These principles guide the analyst long before a tool is opened and long after charts are produced.
For example, defining the wrong problem leads to perfectly executed but useless analysis. No amount of technical sophistication can compensate for poor analytical framing.
The Importance of Analytical Principles
Understanding the principles of data analytics allows analysts to work across tools, industries, and contexts. Tools change rapidly. Principles endure.
Some foundational principles include:
• Problem-driven analysis: Analytics begins with a clear decision or question, not with available data or flashy visuals.
• Data validity and reliability: Analysts must evaluate whether data is accurate, complete, biased, or fit for purpose.
• Logic and reasoning: Correlation does not imply causation, averages can mislead, and outliers matter.
• Contextual interpretation: Numbers only make sense within operational, economic, and social contexts.
• Ethical responsibility: Data can misinform, manipulate, or exclude if used carelessly.
When these principles are weak or absent, analytics becomes a reporting exercise rather than a decision-support function.
Why Tool-Only Analysts Struggle
Professionals who focus exclusively on tools often face limitations. They may produce attractive dashboards that decision-makers do not trust or use. They may struggle when data is messy, incomplete, or ambiguous. They may also find it difficult to adapt when organizations change systems or adopt new technologies.
In contrast, principle-driven analysts can switch tools with relative ease because they understand why an analysis is done, not just how to execute it.
Principles First, Tools Second
This is not an argument against learning tools. Tools matter. However, they should be learned as instruments for applying analytical thinking, not as substitutes for it.
Effective data analytics education and practice should therefore prioritize:
• Analytical problem-solving frameworks
• Statistical and logical reasoning
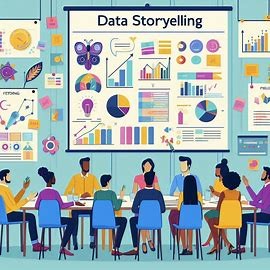
• Data storytelling and decision communication
• Domain understanding
• Critical thinking and skepticism
Once these foundations are strong, tools become powerful accelerators rather than crutches.
Conclusion
Data analytics is not defined by software proficiency but by the ability to convert data into insight and insight into action. Tools are essential, but they are only as effective as the thinking that guides them.
Organizations and professionals that invest only in tool training risk building capacity without capability. Those that invest in analytical principles build resilience, adaptability, and long-term value.
In the end, tools help you work with data, but principles help you think with data.
Why Knowing Data Analytics Tools Is Not the Same as Understanding Data Analytics