Demystifying Data: The Power of Data Storytelling

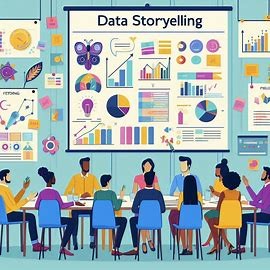
Data storytelling

Demystifying Data: The Power of Data Storytelling

Introduction

Data analytics has evolved from a niche field to a cornerstone of decision-making across industries. While numbers and statistics are essential, the real magic lies in transforming raw data into compelling narratives. Data storytelling is the art of communicating complex insights in a way that resonates with your audience, whether they’re seasoned analysts or business leaders.

The Importance of Data Storytelling

  • Enhanced Decision Making: Stories make information more memorable and actionable, leading to better-informed decisions.
  • Improved Communication: Complex data can be simplified and communicated effectively, fostering collaboration.
  • Increased Engagement: By connecting with the audience on an emotional level, data storytelling drives impact.

Key Elements of Effective Data Storytelling

  1. Know Your Audience: Understand their background, interests, and goals to tailor your story accordingly.
  2. Identify a Compelling Narrative: Find the underlying story in your data. What’s the main message you want to convey?
  3. Choose the Right Visuals: Select charts, graphs, and images that complement your story and enhance understanding.
  4. Use Clear and Concise Language: Avoid jargon and technical terms that might confuse your audience.
  5. Practice and Refine: Storytelling is a skill that improves with practice. Seek feedback and iterate on your approach.

Real-World Examples of Data Storytelling

  • Business: A marketing team uses data to demonstrate the impact of a new campaign on customer acquisition and retention.
  • Healthcare: A researcher tells the story of how data-driven insights led to the development of a life-saving treatment.
  • Social Impact: A non-profit organization uses data to highlight the challenges faced by a community and advocate for change.

Tools and Techniques

  • Data Visualization: Tools like Tableau, Power BI, and Python libraries (Matplotlib, Seaborn) can create stunning visuals.
  • Narrative Building: Consider using storytelling frameworks like the Hero’s Journey or the Freytag Pyramid.
  • Interactive Storytelling: Platforms like Tableau and Looker allow for interactive exploration of data.

Conclusion

Data storytelling is a powerful tool that can transform how we perceive and use information. By mastering the art of weaving data into compelling narratives, you can influence decisions, inspire action, and drive positive change.

Would you like to explore a specific data storytelling technique or industry application in more detail?

8th Floor ZB Chambers
15 George Silundika Avenue,
Harare, Harare 263
Zimbabwe
Phone: 0719397464

slot88

monperatoto

situs slot terbaik

toto slot

slot gacor

pengeluaran hk

situs toto

situs togel

situs toto

kampungbet

situs togel

toto slot

toto slot

toto slot

slot gacor

kampungbet

situs toto

slot gacor hari ini

toto slot

https://ijins.umsida.ac.id/data/

situs toto

toto slot

toto togel

toto slot

kampungbet

toto slot

slot gacor

slot gacor

https://polreskedirikota.id/

slot gacor

Marketing Analytics: From Buzzword to Business Booster

Marketing analytics

Marketing Analytics: From Buzzword to Business Booster

In today’s data-driven marketing world, “marketing analytics” isn’t just a trendy term – it’s a fundamental tool for success. But let’s face it, between website traffic, social media engagement, and campaign performance metrics, it can feel overwhelming.

Fear not, marketing mavericks! This post will break down marketing analytics into actionable steps to transform you from a data skeptic into an insights-driven hero.

Why Marketing Analytics Matters (More Than Ever)

Gone are the days of throwing spaghetti at the marketing wall and hoping it sticks. Today’s consumers are bombarded with messages, and businesses need to be strategic. Marketing analytics empowers you to:

  • Measure ROI: Marketing analytics isn’t just about clicks and likes. It helps you understand the actual return on your marketing investment, whether it’s increased sales, qualified leads, or brand awareness.
  • Optimize Campaigns: Imagine tweaking your Facebook ad in real-time to target the demographics that convert best. Marketing analytics allows you to A/B test different elements and identify what resonates with your audience.
  • Uncover Customer Insights: Your data holds a treasure trove of information about your customers. Analytics helps you understand their online behavior, preferences, and pain points, enabling you to tailor your messaging and offerings for maximum impact.

From Data Deluge to Decision-Making:

Okay, you’re convinced. But how do you navigate the sea of marketing data? Here’s a simplified roadmap:

  1. Set SMART Goals: What do you want to achieve with your marketing efforts? Be specific, measurable, achievable, relevant, and time-bound. This sets the foundation for what data matters most.
  2. Choose the Right Tools: There’s a marketing analytics toolkit for every budget. From Google Analytics to social media insights dashboards, identify tools that align with your goals and data sources.
  3. Analyze and Act: Don’t get bogged down in vanity metrics! Focus on actionable insights that inform your marketing decisions. For instance, identify which landing page copy drives more conversions or which social media platform yields the highest quality leads.
  4. Embrace the Ongoing Process: Marketing analytics is a continuous cycle. Regularly monitor your data, test, and refine your strategies for continuous improvement.

Remember: Marketing analytics is all about harnessing the power of data to make smarter marketing decisions. By embracing this approach, you’ll graduate from best guesses to data-driven strategies that deliver real results.

Bonus Tip: Data visualization tools can turn complex datasets into easy-to-understand charts and graphs, making it simpler to communicate insights to stakeholders.

So, unleash the marketing analytics superhero within you! By leveraging data effectively, you can transform your marketing efforts from good to great.

Supply Chain Analytics Training Course

Human Resources Analytics Training Course

Marketing Analytics Training Course

Microsoft Excel Certification Traininig

8th Floor ZB Chambers
15 George Silundika Avenue,
Harare, Harare 263
Zimbabwe
Phone: 0719397464
Email: info@dataanalysis.co.zw

slot88

toto slot

toto togel

toto slot

https://polreskedirikota.id/

slot gacor

The easiest way to qualify as a data analyst

easiest way to qualify as a Data analyst

The easiest way to qualify as a data analyst

There is no one-size-fits-all answer to this question, as the easiest way to qualify as a data analyst will vary depending on your individual circumstances and experience. However, some general tips that may help you qualify as a data analyst include:

Obtain a relevant degree

A bachelor’s degree in a field such as statistics, computer science, or mathematics is a good starting point for a career in data analysis. However, there are also many online courses and boot camps that can teach you the skills you need to become a data analyst.

Gain experience

Internships and entry-level data analyst positions can give you valuable experience in the field. If you don’t have any experience, you can also start by volunteering your data analysis skills to a local organization.

Develop your skills

There are many resources available to help you develop your data analysis skills. You can take online courses, read books, and attend conferences. You can also practice your skills by working on data analysis projects.

Build a portfolio

A portfolio of your data analysis work is a great way to showcase your skills to potential employers. Be sure to include projects that demonstrate your ability to collect, clean, analyze, and visualize data.

Network

Networking with other data analysts is a great way to learn about new opportunities and get your foot in the door. Attend industry events, join online forums, and connect with data analysts on LinkedIn.

By following these tips, you can increase your chances of qualifying as a data analyst.

Here are some additional tips that may help you qualify as a data analyst:

  • Be proficient in data analysis software. There are many different data analysis software programs available, such as SAS, SPSS, and R. Be sure to become proficient in one or more of these programs.
  • Be able to communicate effectively. Data analysts must be able to communicate their findings to both technical and non-technical audiences. Be sure to develop your communication skills, both written and verbal.
  • Be creative and innovative. Data analysts must be able to think outside the box and come up with new ways to analyze data. Be sure to develop your creativity and problem-solving skills.

If you are interested in a career in data analysis, be sure to start by learning the essential skills and knowledge. With hard work and dedication, you can become a successful data analyst.

Essential skills for data analysts

10 Excel Functions you must know

10 Excel shortcuts you must know

Training Courses

8th Floor ZB Chambers
15 George Silundika Avenue,
Harare, Harare 263
Zimbabwe
Phone: 0719397464
Email: info@dataanalysis.co.zw

slot88

toto slot

toto togel

toto slot

https://polreskedirikota.id/

slot gacor

Why learn Excel?

Why learn Excel?

Why learn Excel?

Why learn Excel in the first place? Microsoft Excel training courses have become increasingly popular in recent years due to the growing need for users to be able to understand and use the software proficiently. Enrolling in formal training helps you learn the different elements faster than if you discover them as you go. Learning how to use Microsoft Excel not only allows you to carry out complex data analysis more quickly and accurately, but also saves you time on other tasks such as creating spreadsheets or graphs.

Boosting your resume

Furthermore, the knowledge you gain from formal training courses can also help boost your resume, showing potential employers that you have a strong understanding of computer software. With the range of benefits that come with taking a Microsoft Excel training course, it is easy to see why such courses are becoming increasingly popular. This is particularly true in the current technological climate, where most employers prefer applicants to have at least a basic understanding of computer software.

Practical skills

Taking a Microsoft Excel course not only allows you to create complex data analysis faster and more accurately, but also gives you the ability to quickly and efficiently create spreadsheets or graphs. Having a comprehensive knowledge of the Microsoft Excel software can thus prove to be very beneficial for potential employees, since it allows them to demonstrate their skills and competence in data management.

Productivity

Additionally, mastering the use of Microsoft Excel is not just advantageous for prospective employees; it is also beneficial for those who are already employed. Being able to effectively utilize the Microsoft Excel software can help employees better manage their data, improve their workflow and productivity, and stay ahead of the curve. It can also give employers confidence in their employee’s ability to successfully handle large data sets and keep up with the latest technology. Therefore, having a deep understanding of the Microsoft Excel software is an invaluable asset in today’s professional environment.


10 Excel Functions you must know

10 Excel shortcuts you must know

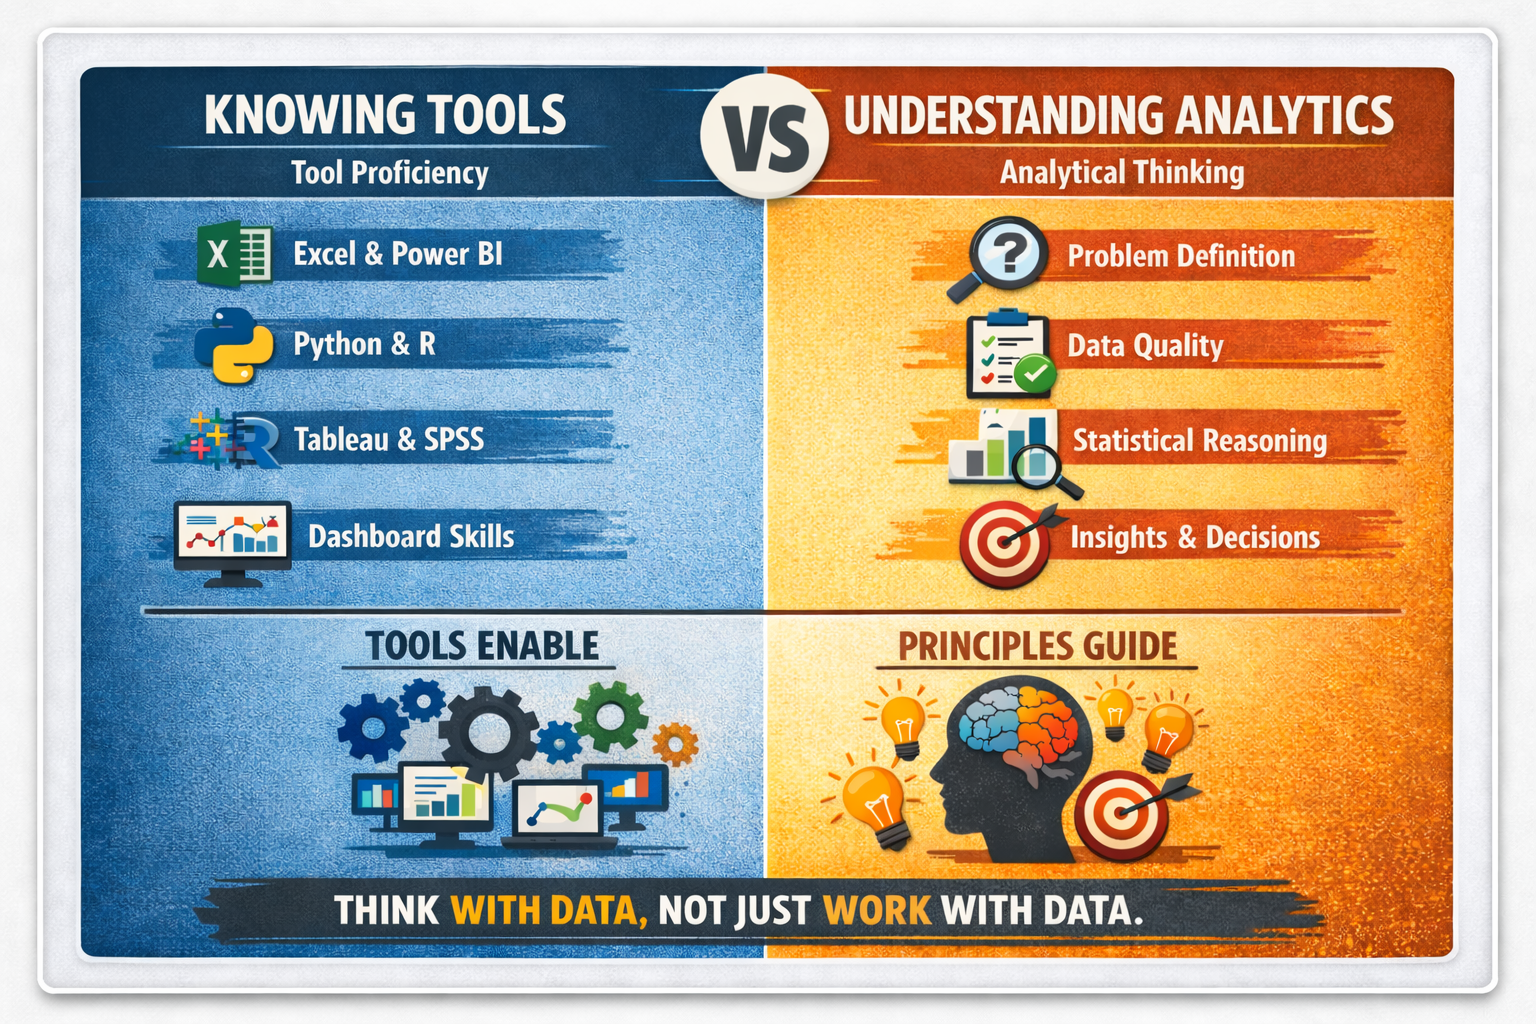
10 principles of data-driven companies

Jobs where Excel skills will pay you handsomely

business analytics using Excel

Jobs where Excel skills will pay you handsomely

Jobs where Excel skills will pay you handsomely are probably the main reason why you should master Excel. The basic spreadsheet may hold the secret to the profession you want, whether you are currently an Excel pro or still have a ways to go. The demand for basic computer abilities in middle-skill professions has significantly increased over the past two years, according to 27 million job advertisements on various recruitment portals. This includes desirable skills for employers like word processing and of course, mastery of spreadsheets.

According to a survey by Capital One and Burning Glass Technologies, having these abilities is not only necessary for the vast majority (82%) of middle-skill professions, but it also opens the door for people without university degrees to high-paying careers.

Excel’s interface may appear straightforward and familiar to everyone, but behind are strength and sophistication that, 30 years after its introduction, are still unsurpassed. Because of this, anyone who wishes to advance in their career should have solid Excel skills. In fact, a sizable percentage of occupations require Excel, according to thousands of job advertisements. This extensive selection may contain the ideal option for you:

Accountants and auditors

These people may have been in mind when Excel was created, with the traditional accounting ledger serving as the basis for spreadsheets. To keep businesses profitable, these experts produce and carefully examine cash flows, income statements, balance sheets, and tax reports. Without a college degree, getting this job would be next to impossible, but having solid Excel accounting abilities and certifications can put you in a better position for leadership positions and promotions.

Administrative assistants, office clerks, information staff

Business operations are facilitated by administrative assistants, who include secretaries and other general office clerks. They set up appointments, handle records, arrange paperwork, create reports, and assist workers, clients, and guests. They frequently use spreadsheet programs like Excel and word processing applications.

Business, management, and market analysts

Business analysts can use a potent Excel function called PowerPivot to extract more insightful information from vast amounts of data and this tool was made specifically for them. These experts support their firms’ strategic business decisions, particularly when it comes to market trends, competitive environments, and long-term profitability. To develop projections, identify strengths, weaknesses, and other patterns, they examine both historical and current data.

Cost estimators

Cost estimators are the best resource for getting the most value for your money. To provide precise estimates of the sum of money, time, and labor needed for a particular project, cost estimators frequently collaborate with project managers and engineers. Excel is used to input all necessary information and perform automatic computations for benchmark amounts.

Educators, teaching assistants, and teachers

In addition to their subject-specific expertise, educators must be adept in planning their classes, monitoring student attendance, and creating lesson plans. The majority of teachers can complete these activities using Excel’s features and support system, making them proficient users of general spreadsheets. Excel is a very important tool for many teachers in their assignments as well as graduate and postgraduate research, in addition to helping them keep track of their students’ contact information.

Financial analysts, investment bankers, and loan officers

Excel is a favored app among financial analysts, bankers, and other money-focused professionals because of its grasp of money.

Financial analysts assist people and businesses in making wise loan or investment decisions. Although they employ a plethora of financial software, spreadsheets are among the most effective tools for analyzing various financial data sets. Excel has therefore become a requirement for this position.

Market research analysts and digital marketers

Data science is at the centre of hard core marketing. Professional market researchers rely on their abilities at acquiring, processing, and analyzing field data, drawing on both creative and analytical thinking. These employees rely on Excel spreadsheets to compile and analyze their research. To reach and convert audiences, marketers look for new market opportunities and employ a variety of tactics, including search engine optimization (SEO). To persuade executives of the effectiveness and return on investment of suggested initiatives, they also employ charts, graphs, and other data visualizations.

Project managers, project coordinators, and construction managers

Project managers can be found in a variety of industries, with the construction and IT sectors dominating. They organize, coordinate, and oversee the creation of software or the construction of various structures. They establish standards, allocate responsibilities to workers, control expenses, and zealously maintain timeliness and budget compliance. Microsoft Excel is one of the main tools they regularly utilize, even if they frequently employ specialist software, to handle a variety of jobs quickly.

Sales, marketing, training and administrative managers

Given that both sales and marketing are referred to as “numbers games,” it is evident that they incorporate numbers. Spreadsheet software follows numbers wherever they go. While planning, scheduling, and organizing various tasks and resources, frequently with associated budgets and timestamps, are necessary for administration and training. Excel naturally helps make sense of everything when time and money are important. Managers rely on Excel to carry out their primary duties, which range from market research and inventory management to financial modeling and data analysis.

The list is not exhaustive but a good illustration of why everyone needs to learn Excel.

10 must know Excel shortcuts

Microsoft Excel Training Course for beginners

Microsoft Excel Training Course for Intermediate level

Advanced Microsoft Excel Training Course

Microsoft Excel Data Analysis Training Course

8th Floor ZB Chambers
15 George Silundika Avenue,
Harare, Harare 263
Zimbabwe
Phone: 0719397464


10 principles of data-driven companies

Data-driven company

10 principles of data-driven companies

10 principles of data-driven companies presented to you by Data Analysis Training Course and Advisory Services Zimbabwe. Data and analytics are essential to objective, informed decision making. With the right practices in place, companies are able to harness the power of data to provide better service to their customers, optimize their supply chains and understand the effectiveness of their marketing efforts.

Though the benefits of using the right data in just the right ways are obvious, many companies don’t have the right principles in place. The result? Up to 70% of projects don’t come to fruition.

Use these 10 guiding principles to optimize your org to be truly data driven.

1. Answer what, why and where.

Often, organizations will collect a ton of data without considering why—resulting in too much information to make sense of. Spend time at the outset figuring out what answers you’re looking for, why, and what you’ll do with those answers when you get them.

Next, figure out where the answers will come from. The monthly dashboard or spreadsheet you use to find answers is likely riddled with underlying manipulation and transformation, as data analysts manually create spreadsheets every month using data queried from a database where they’ve applied several layers of business logic, and that has been enriched with third-party information.

2. Understand data gaps and quality issues.

When gaps or quality issues are uncovered, data-driven organizations take the time to rationalize the problem. This can mean going back to your systems and enforcing more rigid requirements on data entry, or building a new system to capture the desired data. It can also mean more clearly defining the transformation and rationalization steps that need to happen with data before it becomes intelligence.

3. Define roles and ownership.

Once the components are in place to understand what to measure and why, where the information comes from, how its captured and what you need to do to it, it’s time for the who. Modern analytics strategies in particular tend to originate from the business side, meaning that IT is often forced to manage a solution they had no say in. A lack of roles and ownership results in scenarios where projects never get sign off and the infrastructure doesn’t get managed.

Once you’ve figured out the who, you’re primed to execute on your data initiatives.

4. Visualisation best-practices matter.

This is the fun part! Choosing the right display to present and explain data is critical to ensuring that the data gathered is met with understanding and utility. Start with an understanding of which chart best represents how the data should be interpreted. If you’re trying to measure a single measure comparatively, for example, consider a bar chart. A scatterplot is perfect for multiple measures and a line chart works great for time-based analysis.

A single dashboard can have more impact by tending to core design elements like layout, color, typography and size, and is how data visualization goes from “good” to “great”. Some tips:

• Don’t overuse color. It should be used purposefully with mindfulness about the absence of color to ensure the data gets seen.

• Font selection and what words get chosen as companions to the dashboard should have equal importance.

• Keeping size in mind ensures that content gets used.

• Avoid design that is over-the-top and chaotic.

5. Share stories

Stories are memorable. They inspire. They communicate the journey and reason behind analysis, and help create empathy and attachment to the outcome. Sharing data stories can become a natural template to inspire new analytics projects, and enhance overall communication and collaboration between different workgroups and silos.

One great way to get started sharing stories is to start a monthly analytics meeting. You could also send out newsletters or hijack a town hall to give a quick update on your analytics projects.

6. Leave them wanting more

Analytics done right leaves the audience wanting more. “More” can mean a lot of things—and it’s all about future initiatives or enhancements to analytics projects. Focus on these three keys:

1. Delivering more insights

Good analytics starts by answering questions and begs for more insights to be found: more     precise questions, more granular details of a subject area and gathering insights for new     subject areas.

2. Deeper questions

Instead of monitoring and measuring segregated subject areas, you should start to find     relationships among them. Deeper questions are also those that veer into the world of data     science, where the conversation shifts from “What happened?” to “What IF this happens?”

3. Enriched data

This means trying to fill in those data gaps identified earlier.

7. Focus on iteration

It can be easy to get overwhelmed by the notion that everything needs to be built and perfected on the first go. Data-driven organizations know that data analytics is iterative. That means it’s a process that can and should be repeated. Focus on starting with and connecting the business understanding, layering in the data understanding, taking time to prepare the data and associated analysis, then evaluating the results and deploying. Along this path, it’s not uncommon to go back, start over or repeat the cycle a few times before something is finalized.

8. Measure utilisation and adoption

Measurement is the key to understanding user behaviors, from consumption to creation. It’s also key to being able to plan for the delivery of the “more”, and is your first line of defense for knowing how you’ll need to scale. The three recommended subject areas to focus on are: user engagement, utilization and performance.

9. Build champions

Champions are known for their leadership and evangelism, which means they’re able to amplify the voice of analytics. They understand the mission and the goal—using data to drive decisions. They know that weaving data and facts into strategy is the competitive edge your organization needs to thrive. They’re key to promoting utilisation, adoption and awareness around analytics initiatives.

Once you’ve identified potential champions, continuously work to get them more connected to analytics projects and more involved in the strategy.

10. Celebrate victories

Data and analytics are a journey! You can learn more about how to make it a smooth one in our expert-led data analysis training sessions available on demand.

Microsoft Excel Data Analysis Training Course

Advanced Statistical Analysis Using SPSS Training Course

SPSS Data Analysis Training Course

8th Floor ZB Chambers
15 George Silundika Avenue,
Harare, Harare 263
Zimbabwe
Phone: 0719397464

Data monetisation

data analysis

One trend in data that has taken hold is monetisation. Monetising data refers to how companies can utilise their domain expertise to turn the data they own or have access to into real, tangible business value or new business opportunities. Data monetisation can refer to the act of generating measurable economic benefits from available data sources by way of analytics, or, less commonly, it may refer to the act of monetising data services. In the case of data analytics, typically these benefits appear as revenue or cost savings, but they may also include market share or corporate market value gains.

One could argue that data monetisation for increased company revenue or cost savings is simply the result of being a data-driven organisation. Though that argument isn’t totally wrong, company leaders are taking an increasing interest in the market to explore how data monetisation can drive the innovation of entirely new business models in various different business segments.

One good example of how this process can work is when telecom operators sell data on the positions of rapidly forming clusters of users (picture the conclusion of a sporting event or a concert by the latest YouTube sensation) to taxi companies. This allows taxi cars to be available proactively in the right area when a taxi will most likely be needed. This is a completely new type of business model and customer base for a traditional telecom operator, opening up new types of business and revenues based on available data.

What does a data analyst do?

Why you should use data analysis in business

Contact us

    What does a data analyst do?

    What does a data analyst do?

    Data Analysts need to know a whole lot more than just how to crunch numbers. Digging through spreadsheets and connecting the dots are crucial aspects of what a data analyst does, but you’ll also need to know how to communicate and collaborate with others to get your point across, to ensure your team comprehends what’s happening.

    What else do data analysts do all day? In this profession, you’re tasked with scouring over large amounts of raw data sets, cleaning that information so that it makes sense, then gleaning business insights and analysis, to turn that information into actionable steps to help your company.

    The information you find could help your business in various ways, like improving operational processes, allowing the company to cut back costs, or increasing ways to earn more revenue. For instance, if you were a data analyst in a sporting discipline, your main responsibilities could include using analytical techniques to uncover why certain consumer behavior is prevalent on different game days. In different industry contexts, data always has the power to help solve problems. Because of this, there are endless ways companies utilize data analysts for business needs.


    Why you should use data analysis in business

    why you should use data analysis in business

    Why you should use data analysis in business

    In most cases, the business will not realize the value which data analysis can add to their businesses. Whilst this has not been fully appreciated, the data which businesses generate and collect on a day to day basis provide opportunities for improving their service and hence business performance. It is a pity that despite having data collected on a daily basis in day to day operations, many a business do not even make the effort to utilize the data. Worse still, some do not even collect data or keep records of their operations. T start with let me give an example of how a business can utilize data to improve its performance. Of course, this is not a matter of immediate returns but in business, we need to have a long-term view.

    Let us consider company X which is in the business of supplying a seasonal item, raincoats. In 2020 they received 70 requests for quotations of which they managed to secure 15 sales. It is not important whether you consider that a good return or not but let us look ahead. If they have kept a record of all the enquiries, including contact persons, email addresses and phone numbers that means once they have their supplies ready for the next season in 2021, they have a database of 70 customers to contact directly rather than having to wait for enquiries. Moreover, they have should have done some analysis on why they did not get the order in 2020, and will now make the necessary adjustments. Maybe 20 potential clients were lost because they didn’t have PRAZ. Maybe another 10 were lost because they did not have a NOSTRO account. Maybe some were not comfortable with paying 75% as they requested. Or for some, they just did not have the right colour. An analysis of customer feedback from 2020 can help them to make the necessary adjustments and get the order this time. Knowing why they did not get the order last time will improve their chances of getting it this time. With an analysis of how they performed in 2020 and the factors which influenced performance, they can definitely get more business in 2021. For the new season, they can contact customers, making sure to inform them they have resolved the concerns that were a deal-breaker last time. Like “We now have raincoats in stock and we have now registered for PRAZ.” Of course, they will also benefit by contacting the customers who bought from them last time even before they start looking around. Some will give you the order straight away on the strength of the good service in the last year. The result should be an increase in sales from last year. That approach, repeated year after year will see the business grow.

    The issue of seasonal products does not only apply to products that are seasonal in nature. Sometimes it is your clients’ use of a product that is seasonal and that same approach of analyzing customer engagements is needed.

    Data monetisation

    What does a data analyst do?

    8th Floor ZB Chambers
    15 George Silundika Avenue,
    Harare, Harare 263
    Zimbabwe
    Phone: 0719397464